. 2015 Nov 24;112(47):E6579-88.
doi: 10.1073/pnas.1515308112. Epub 2015 Nov 9.

Circadian and feeding rhythms differentially affect rhythmic mRNA transcription and translation in mouse liver

Affiliations

Circadian and feeding rhythms differentially affect rhythmic mRNA transcription and translation in mouse liver

Florian Atger et al. Proc Natl Acad Sci U S A. .

Abstract

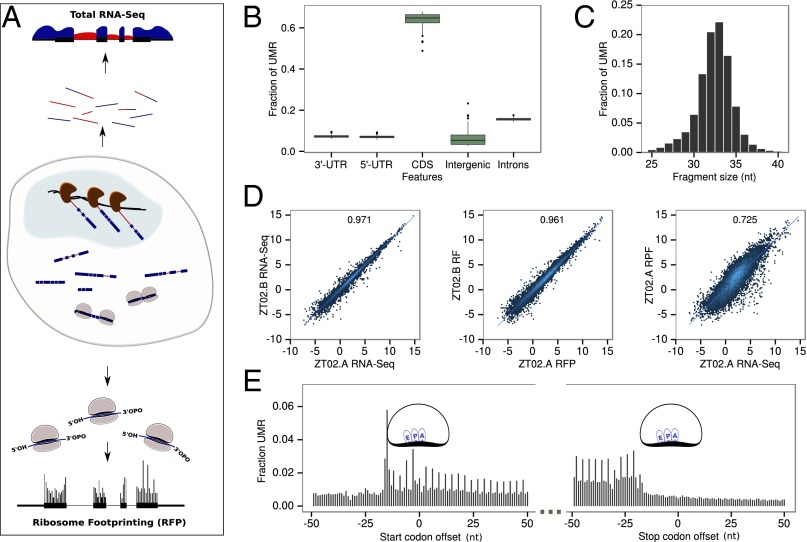
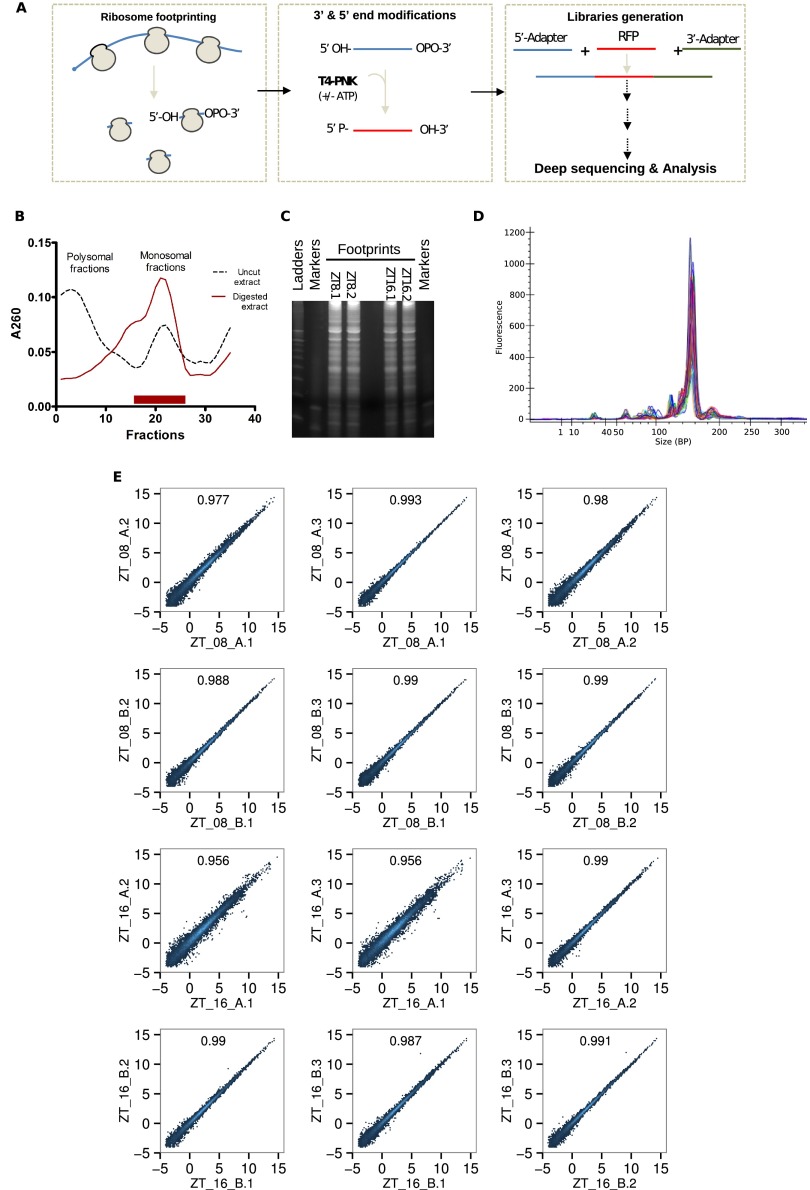
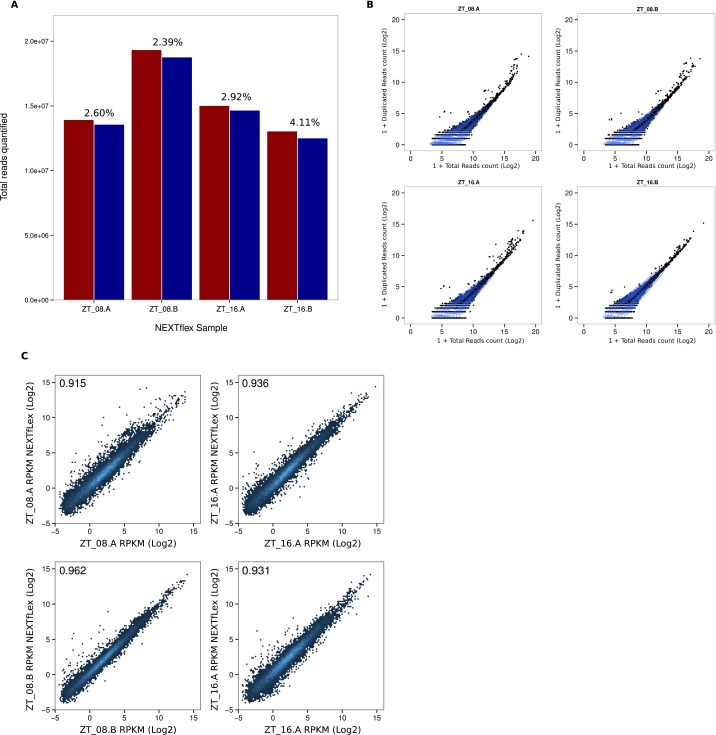
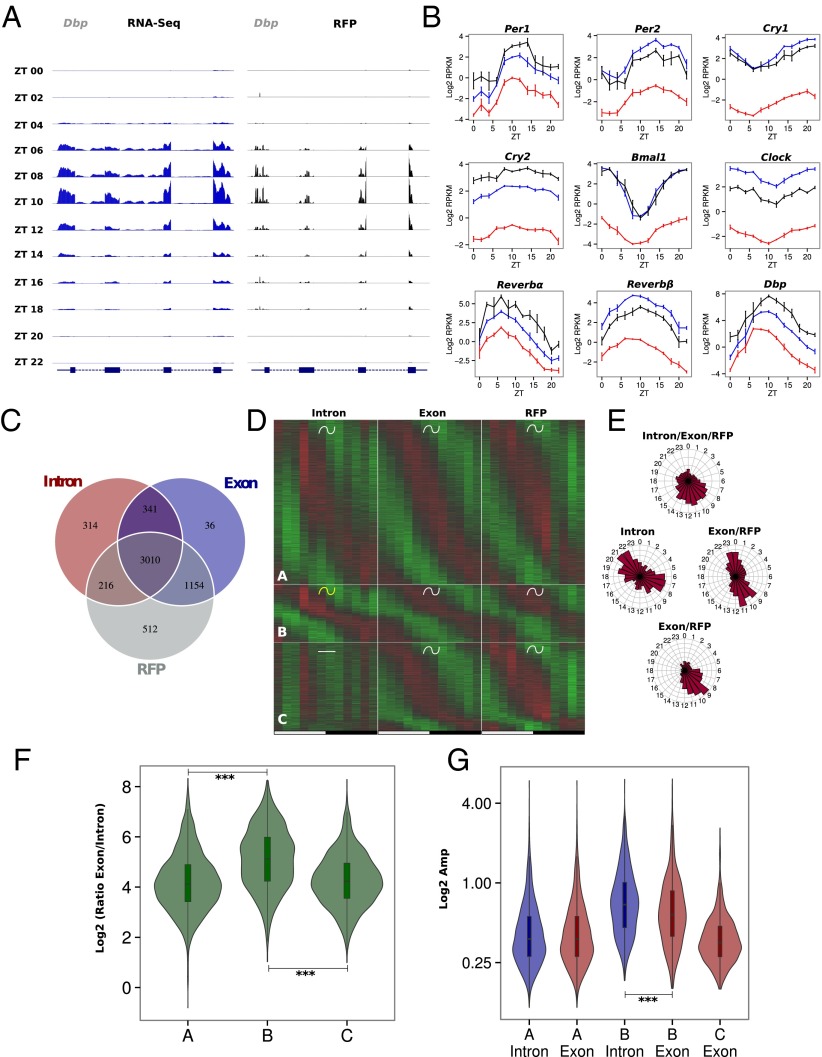
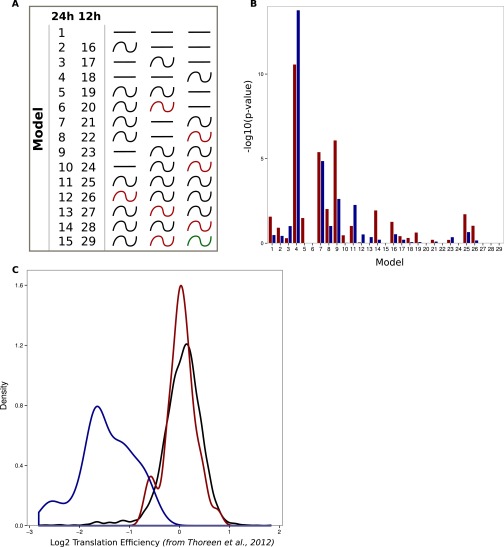
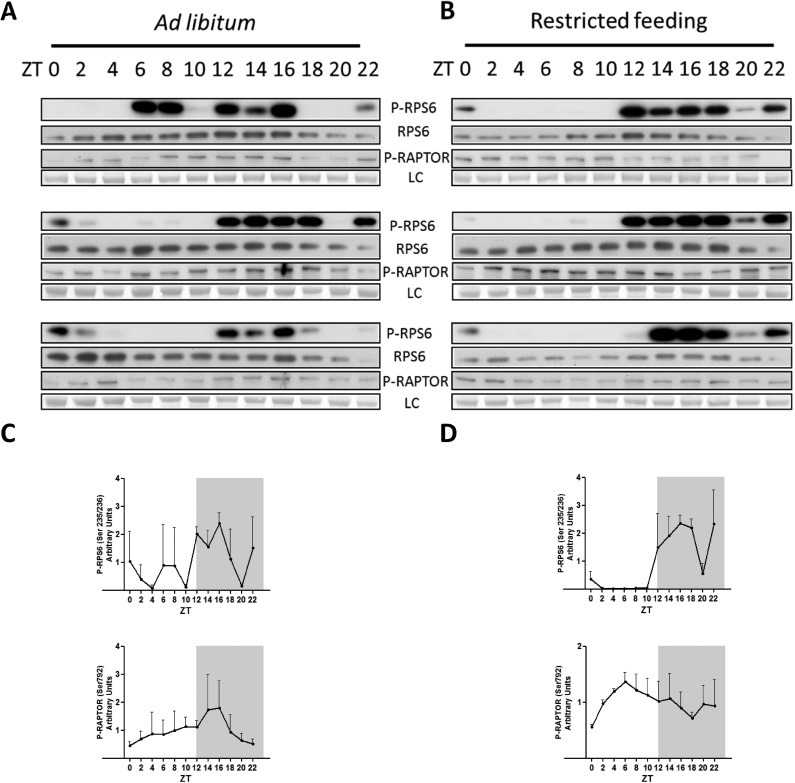
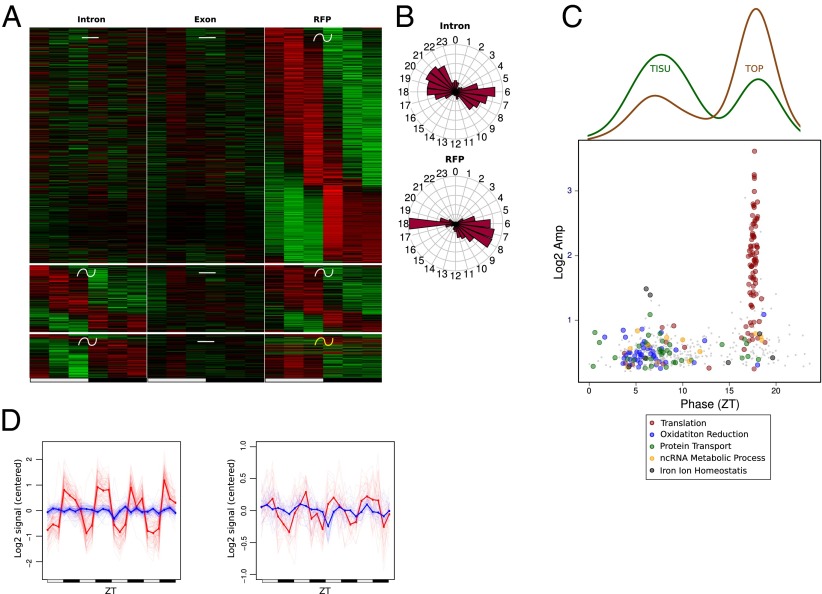
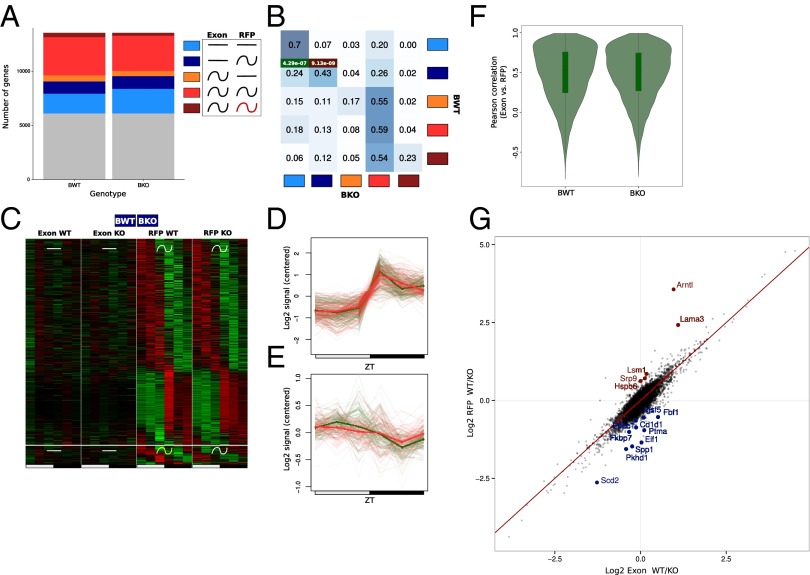
Diurnal oscillations of gene expression are a hallmark of rhythmic physiology across most living organisms. Such oscillations are controlled by the interplay between the circadian clock and feeding rhythms. Although rhythmic mRNA accumulation has been extensively studied, comparatively less is known about their transcription and translation. Here, we quantified simultaneously temporal transcription, accumulation, and translation of mouse liver mRNAs under physiological light-dark conditions and ad libitum or night-restricted feeding in WT and brain and muscle Arnt-like 1 (Bmal1)-deficient animals. We found that rhythmic transcription predominantly drives rhythmic mRNA accumulation and translation for a majority of genes. Comparison of wild-type and Bmal1 KO mice shows that circadian clock and feeding rhythms have broad impact on rhythmic gene expression, Bmal1 deletion affecting surprisingly both transcriptional and posttranscriptional levels. Translation efficiency is differentially regulated during the diurnal cycle for genes with 5'-Terminal Oligo Pyrimidine tract (5'-TOP) sequences and for genes involved in mitochondrial activity, many harboring a Translation Initiator of Short 5'-UTR (TISU) motif. The increased translation efficiency of 5'-TOP and TISU genes is mainly driven by feeding rhythms but Bmal1 deletion also affects amplitude and phase of translation, including TISU genes. Together this study emphasizes the complex interconnections between circadian and feeding rhythms at several steps ultimately determining rhythmic gene expression and translation.

Keywords: 5′-TOP sequences; TISU motifs; circadian rhythms; mRNA translation; ribosome profiling.


Conflict of interest statement

Conflict of interest statement: F.A., C.G., J.M., E.M., B.W., G.L., P.D., and F.G. are employees of Nestlé Institute of Health Sciences SA.

Figures

Fig. 1.
Fig. 1.
Ribosome profiling around the diurnal cycle in mouse liver. (A) Schematic representation of the experiment. Total mRNAs are directly sequenced (top) and ribosome loaded-mRNA are purified (ribosome footprinting) before sequencing (bottom). RNA-Seq from total RNA (genomic sequence is represented by a black line, surrounded by RNA-Seq signal) is quantified in intronic (red) and exonic (blue) regions to estimate pre-mRNA and mRNA levels. Ribosome density is quantified by modified ribosome profiling protocol. (B) The overall fraction of uniquely mapped reads (UMRs) of size between 28 and 34 bp up to one mismatch from the 84 Ribo-Seq samples in protein CDSs and nonprotein coding regions. (C) Size distribution of RFPs for UMR up to one mismatch. (D) Reproducibility of biological replicates. (Left) Log2 of total normalized counts (reads per kilobase per million, RPKM) for exonic RNA-Seq. (Middle) Ribo-Seq. (Right) Comparison of RPKM for Ribo-Seq and exonic RNA-Seq for each annotated protein coding gene (only UMR). R2 indicates Pearson correlation at the top of each panel. (E) Density of 5′ ends of 32-nt ribosome footprints at the starts and ends of ORFs shows three nucleotides periodicity. Positions of the related E, P, and A sites of the ribosomes are indicated.
Fig. S1.
Fig. S1.
Technical validation of ribosome profiling experiments. (A) Simplified representation of the modified ribosome profiling method. RNase I digestion leaves a 5′-OH and a 3′-cyclophosphate. T4 polynucleotide kinase treatment performed in the absence of ATP converts the 3′-cyclophosphate into a 3′-OH whereas phosphorylating the 5′-OH ends in presence of ATP. Libraries are then generated as described in Materials and Methods. (B) Example of 260-nm optical density profile from sucrose gradient fractions. RNase I-digested lysates (red line) harbor clear monosome enrichment, whereas untreated controls (dark dashes) exhibit a standard polysome-enriched profile. Monosomal RNA was then extracted from fractions delimited with a red bar. (C) Extracted RNAs were resolved on 15% TBE-urea-PAGEs to select 28- to 36-nt-long RNA fragments. (D) Homogenous size distribution of libraries with a strong and sharp library peak at the expected size (∼150 bp). (E) Technical reproducibility of technical replicates for each individual gene (log2 RPKM). R2 indicates Pearson correlation at the top of each panel. Four samples (two per time point) were treated as described before. Then, fragmented RNAs were split, resolved on three distinct 15% TBE-urea-PAGEs, and analyzed as described in Materials and Methods.
Fig. S2.
Fig. S2.
Validation of Ribo-Seq libraries (NextFlex). (A) NEXTflex libraries were generated from four different samples with randomly barcoded adapters to identify duplicated reads and possible adapters bias. Total numbers of reads quantified with (red) or without (blue) duplicated sequences are represented. For each sample, percentages of duplicated reads are indicated. (B) Number of duplicated reads sequences in function reads counts (log2) for individual genes. Blue lines represent densities of genes and are aggregated around minimal duplicated values. (C) Reproducibility of RFP signals (RPKM log2) obtained with NEXTflex and TrueSeq protocols. Correlation scores are represented in each plot.
Fig. 2.
Fig. 2.
Rhythmic ribosome footprint signals are mainly driven by rhythmic mRNA accumulation. Model selection to assess rhythmicity is applied on WT ad libitum datasets combining intronic, exonic, and RFP signal. Harmonic regression is used with a period of 24 h and 12 h. Genes are assigned to one of the 29 models described in Fig. S5A. An arbitrary threshold of 0.4 is set on the BIC weight. Genes with log2 RPKM >0 at the exon and RFP levels are selected. (A) Exon RNA-Seq (Left) and RFP (Right) signals for the circadian clock-regulated Dbp gene. The two signals synchronously peak at ZT10. (B) Pre-mRNA (red), mRNA (blue), and RFP (black) signals in log2 RPKM for circadian clock core genes and clock-controlled genes. (C) Number of genes with rhythmic pre-mRNA, mRNA, and RFPs. The largest group shows rhythms on all three levels. (D) Three groups of genes showing identical mRNA and RFP rhythms. Standardized relative expression is indicated in green (low) and red (high). White and black boxes represent light and dark periods, respectively. (E) Phase distribution of the three groups described in D. (F) Distribution of mRNA (Exon)/pre-mRNA (Intron) ratios for the three groups of genes. An increased ratio suggested a more stable mRNA and longer half-life. A Welch′s t test indicates that this ratio is significantly higher in group B compare with groups A (P = 1⋅10−62) and C (P = 1⋅10−49). (G) Distribution of pre-mRNA (blue) and mRNA (red) amplitudes for the three groups. Group B harbors decreased amplitude in exons compare with introns (paired t test: P = 5⋅10−13) as a consequence of long half-lived transcripts, despite a general trend for higher amplitude.
Fig. 3.
Fig. 3.
Effects of Bmal1 deletion on rhythmic mRNA accumulation. Model selection to assess rhythmicity is applied on Bmal1 WT and KO RF dataset combining intronic, exonic, and RFP signal. Harmonic regression is used with a period of 24 h. Genes are assigned to one of the 877 models generated by the six conditions. A threshold of 0.1 is set on the BIC weight. Genes with log2 RPKM >0 at the exon and RFP levels in WT condition are selected. (A) Genes are clustered in the six groups depending of the model they were assigned and grouped in function of their rhythmic pattern at the intronic and exonic level: gray, genes not assigned in any group; light blue, constant pre-mRNA and mRNA levels; dark blue, constant pre-mRNA and rhythmic mRNA; orange, rhythmic pre-mRNA and constant mRNA; red, rhythmic pre-mRNA and mRNA; brown, rhythmic pre-mRNA and mRNA with different rhythmic parameters. (B) Fraction of genes belonging in one of the five clusters in KO compared with WT mice. Intensity of the blue color in each box represents the conservation degree of behavior of the genes between WT and KO, with darkest blue corresponding to higher conservation. (C) Phase distribution of rhythmic pre-mRNA in WT and KO mice. (D) Phase distribution of rhythmic mRNA in WT and KO mice. (E) Distribution of pre-mRNA amplitudes in WT and KO mice. KO mice present slightly increased amplitude compare with WT (paired t test: P = 1⋅10−4). (F) Distribution of mRNA amplitudes in WT and KO mice. KO mice present decreased amplitude compare with WT (paired t test: P = 1⋅10−32). (G) Fourier transform is applied for genes belonging to the dark blue cluster in WT and red in KO mice. Distribution of amplitude density for the 24-h and 12-h harmonics are computed for WT animals. The high component of the 12-h harmonic indicates a predominantly 12-h rhythmic pre-mRNA level (paired t test: P = 2⋅10−6).
Fig. S3.
Fig. S3.
mRNA accumulation mainly drives protein rhythm. Proteins identified and quantified for at least eight time points in published MS data (14) were analyzed and compared with corresponding exonic and RFP reads obtained in our ribosome profiling data. Rhythmicity was assessed by performing a multiple linear regression for each relative time as described in ref. . Exonic, RFP, and MS signals were considered rhythmic for corrected P value (Benjamini–Hochberg method, ref. 82) below 0.25. (A) Venn diagram showing number of rhythmic proteins (green), mRNAs (blue), and rhythmic RFPs (gray). (B) Phase distributions of the 100 rhythmic proteins (green) encoded by rhythmic mRNA (blue) and RFP (gray). (C) Phase delays between mRNA and RFPs (Left) for group B show that phase of translation follows mRNA accumulation phase. Protein accumulation occurs mainly 4–6 h after the peak of RFP signal (Right).
Fig. S4.
Fig. S4.
AC represent examples of individual profiles from genes classified in groups A, B, and C by the model selection method, respectively (Fig. 2). Individual profiles from genes classified in groups A, B, and C by model selection method (Fig. 2D). Log2 RPKM of intronic (red), exonic (blue), and RFP (black) signals are represented for genes involved in enriched biological processes identified by GO analysis (Dataset S2).
Fig. 4.
Fig. 4.
Translation efficiency is regulated during the diurnal cycle for genes with 5′-TOP and TISU motifs. We used the same rhythmic analysis as in Fig. 2. (A) Exon RNA-Seq (Left) and RFP (Right) signals for the ribosomal protein gene Rps9 show increased translation during the dark phase. (B) Expression heat map for the three genes groups showing rhythmic RFP but constant mRNA levels. (Top) Constant transcription and mRNA abundance followed by rhythmic translation. (Middle) Constant mRNA abundance with similar rhythmic parameters for transcription and translation. (Bottom) Constant mRNA abundance with differential rhythmic transcription and translation. (C) Phase distribution of intronic and RFP signals for genes in B. (D, Bottom) Log2 amplitudes and phases of RFP signal for genes in B, colored by enriched functions. (Top) Densities indicate respectively fraction of TISU and TOP motifs at each phase. (E and F) Mean of relative expression profiles across genes with TOP (E) or TISU (F) motifs in D with phase respectively between ZT15–20 and ZT7–13. Exonic signals are in blue and RFPs signals in red.
Fig. S5.
Fig. S5.
Enrichment for TOP and TISU genes in model presenting rhythmic translation efficiency. (A) Schematic representation of the 29 possible rhythmic patterns. Models 2–15 and 16–29 classify genes following a 24- or 12-h period, respectively. Depending on the pattern, red-colored waves represent different rhythmic parameters compared with the black ones. (B) Genes harboring TISU (red bars) and TOP (blue bars) motif are predominantly found in models describing rhythmic translation from constantly expressed mRNAs (models 4, 7, and 8). P values were calculated using a hypergeometric test. (C) Torin 1-induced changes in translation efficiency (32) is observed for genes with TOP (blue) and TISU (red) motifs in Fig. 4. Black line represents all genes. Genes with TOP motifs, but not TISU, are responsive to mTOR inhibition.
Fig. S6.
Fig. S6.
Feeding conditions differentially affect TORC1 and AMPK activities in WT mouse liver. (A) Diurnal phosphorylation profile of RPS6 (S235/236) and RAPTOR (Ser792) analyzed by Western blotting in ALF conditions. (B) Same as A in RF conditions. (C and D) Densitometry measurements of P-RPS6 (Top) and P-Raptor (Bottom) signals of A and B, respectively. Western blot analyses were normalized to the temporal means.
Fig. 5.
Fig. 5.
Rhythms in translation efficiency are sharpened under time RF. Model selection to assess rhythmicity is applied on both WT RF datasets pooled together, and uses intronic, exonic, and RFP signals. Harmonic regression is used with a period of 24 h. Genes are assigned to one of the 15 models generated by the three conditions. An arbitrary threshold of 0.4 is set on the BIC weight. Genes with Log2 RPKM >0 at the exon and RFP levels are selected. (A) Heat map for the three genes groups showing rhythmic RFP signals and constant mRNA level under RF. (Top) Constant transcription and mRNA abundance followed by rhythmic translation. (Middle) Constant mRNA abundance with similar rhythmic parameters for transcription and translation. (Bottom) Constant mRNA abundance with differential rhythmic transcription and translation. (B) Phase distribution of intronic and RFP signals for genes in A. (C, Bottom) Log2 amplitudes and phases of RFP signal for genes in A, colored by enriched functions. (Top) Densities indicate respectively fraction of TISU and TOP motifs at each phase. (D) Mean of relative expression profile across genes with TOP (Left) or TISU (Right) motifs in B with phase respectively between ZT15–20 and ZT4–10. Exonic signals are in blue and RFPs signals in red.
Fig. 6.
Fig. 6.
Bmal1 deletion affects translation efficiency in a constrained group of genes. The rhythmic analysis used is the same as for Fig. 3. (A) Gray, genes not assigned in any group; light blue, constant mRNA and RFP levels; dark blue, constant mRNA and rhythmic RFP; orange, rhythmic mRNA and constant RFP; red, rhythmic mRNA and RFP; brown, rhythmic mRNA and RFP with different rhythmic parameters. (B) Fraction of genes belonging in one of the five clusters in KO compared with WT mice. Intensity of the blue color in each box represents the conservation degree of behavior of the genes between WT and KO, with darkest blue corresponding to higher conservation. Hypergeometric test for TOP and TISU enrichment in the different cluster is applied. P values for the best enrichments are displayed in green and red for TISU and TOP motifs, respectively. (C) Heat map of the exonic and RFP signal for genes harboring a constant exonic and rhythmic RFP signal in WT and KO mice. (Top) Rhythmic parameters of RFP signals are shared between WT and KO mice. (Bottom) Rhythmic parameters of RFP signals are different between WT and KO mice. (D) Mean of relative RFP profiles across genes with TOP motifs in C with phase between ZT15–20 in WT (red) and KO (green) mice. Individual genes are shown as thin lines. (E) Mean of relative RFP profiles across genes with TISU motifs in C with phase between ZT4–10 in WT (red) and KO (green) mice. Individual genes are shown as thin lines. (F) Pearson correlation between RFP and fragmented exon RNA-Seq in WT and KO test. Translation is mainly dictated by mRNA pattern in WT and KO. (G) Log2 ratio of RFP and fragmented exonic RNA-Seq signals (UMR) between WT and KO mice, taken as a measure of (relative) translation efficiency. Genes showing a significantly (false discovery rate ≤0.05) increased (logFC < −0.5) or decreased (logFC > 0.5) in translation efficiency in KO mice are colored in blue and red, respectively.

References

    1. Dibner C, Schibler U. Circadian timing of metabolism in animal models and humans. J Intern Med. 2015;277(5):513–527. - PubMed
    1. Gerhart-Hines Z, Lazar MA. Circadian metabolism in the light of evolution. Endocr Rev. 2015;36(3):289–304. - PMC - PubMed
    1. Baron KG, Reid KJ. Circadian misalignment and health. Int Rev Psychiatry. 2014;26(2):139–154. - PMC - PubMed
    1. Vyas MV, et al. Shift work and vascular events: Systematic review and meta-analysis. BMJ. 2012;345:e4800. - PMC - PubMed
    1. Crane BR, Young MW. Interactive features of proteins composing eukaryotic circadian clocks. Annu Rev Biochem. 2014;83(1):191–219. - PubMed

Publication types

MeSH terms

Associated data