. 2015 Nov 24;112(47):E6535-43.
doi: 10.1073/pnas.1514152112. Epub 2015 Nov 9.

Leukocyte-specific protein 1 regulates T-cell migration in rheumatoid arthritis

Affiliations

Leukocyte-specific protein 1 regulates T-cell migration in rheumatoid arthritis

Seong-Hye Hwang et al. Proc Natl Acad Sci U S A. .

Abstract

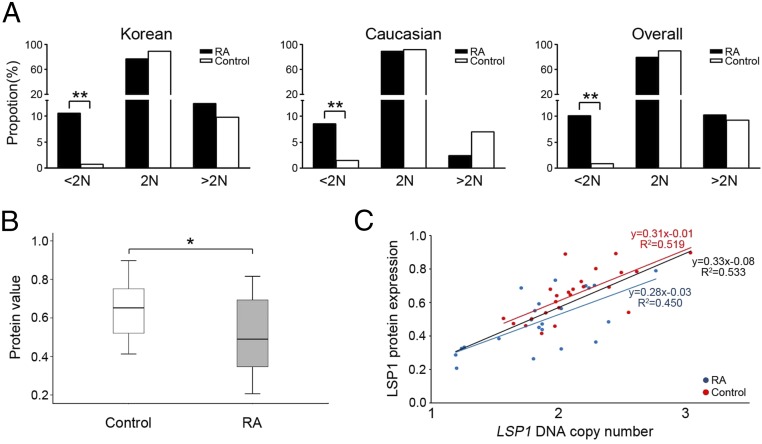
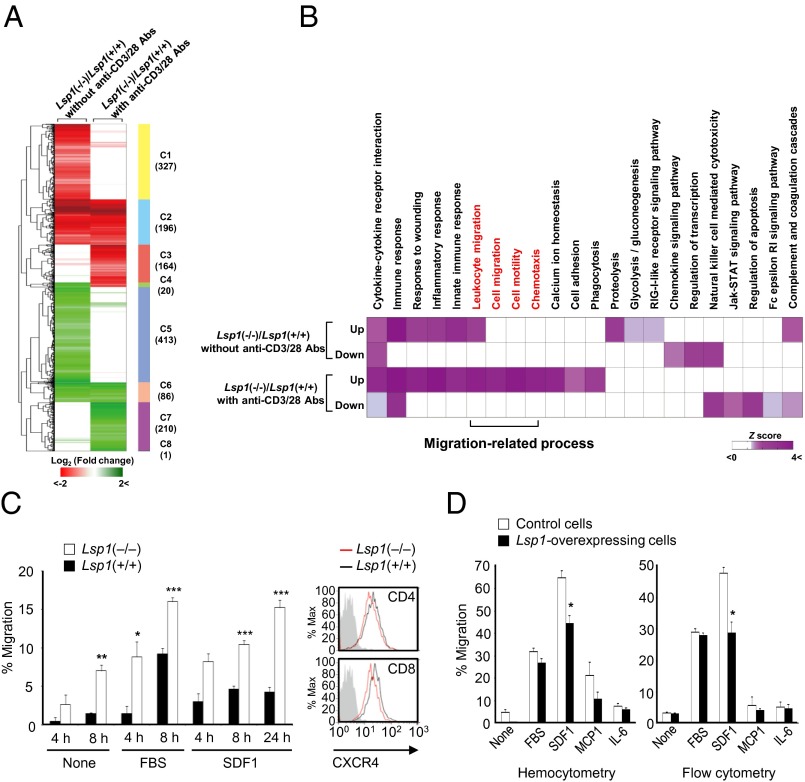
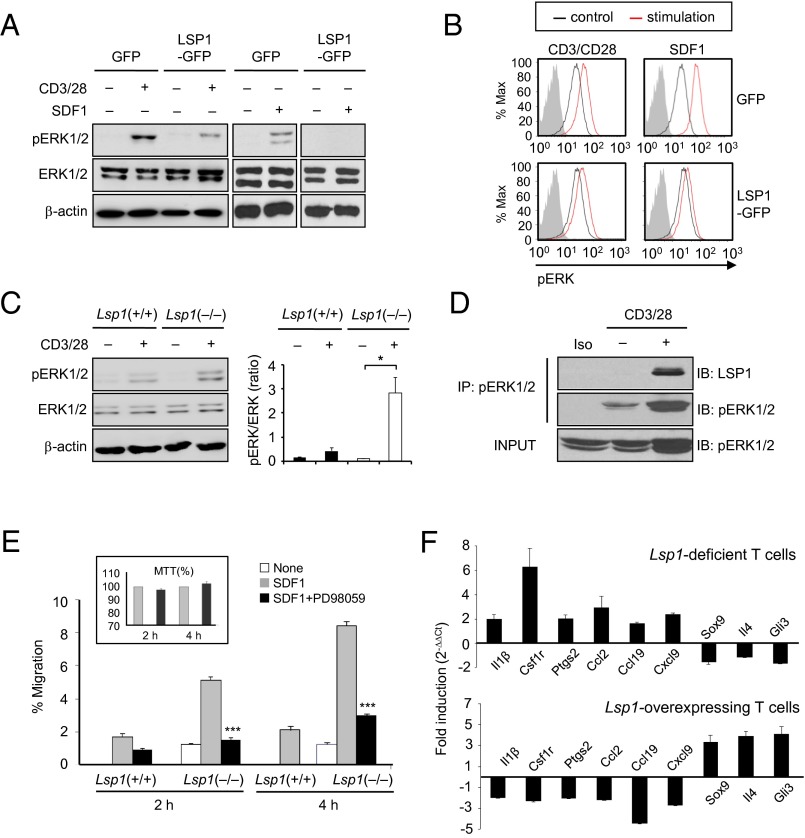
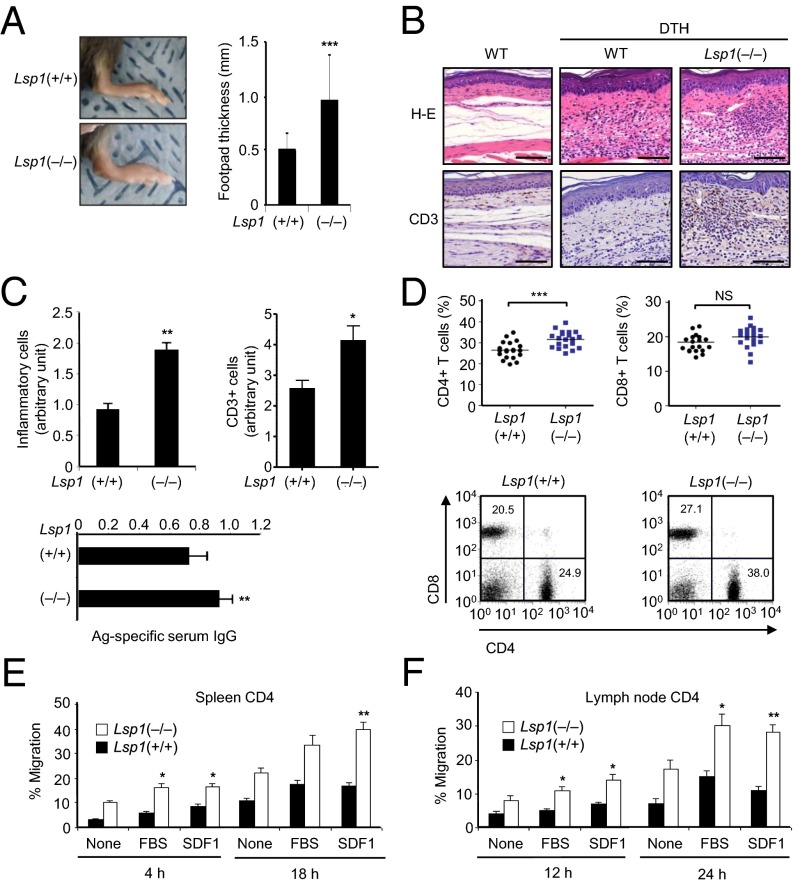
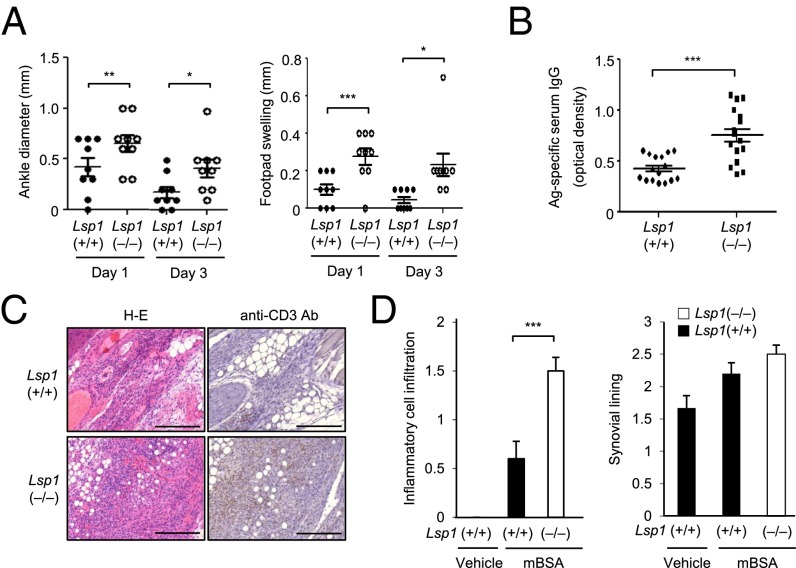
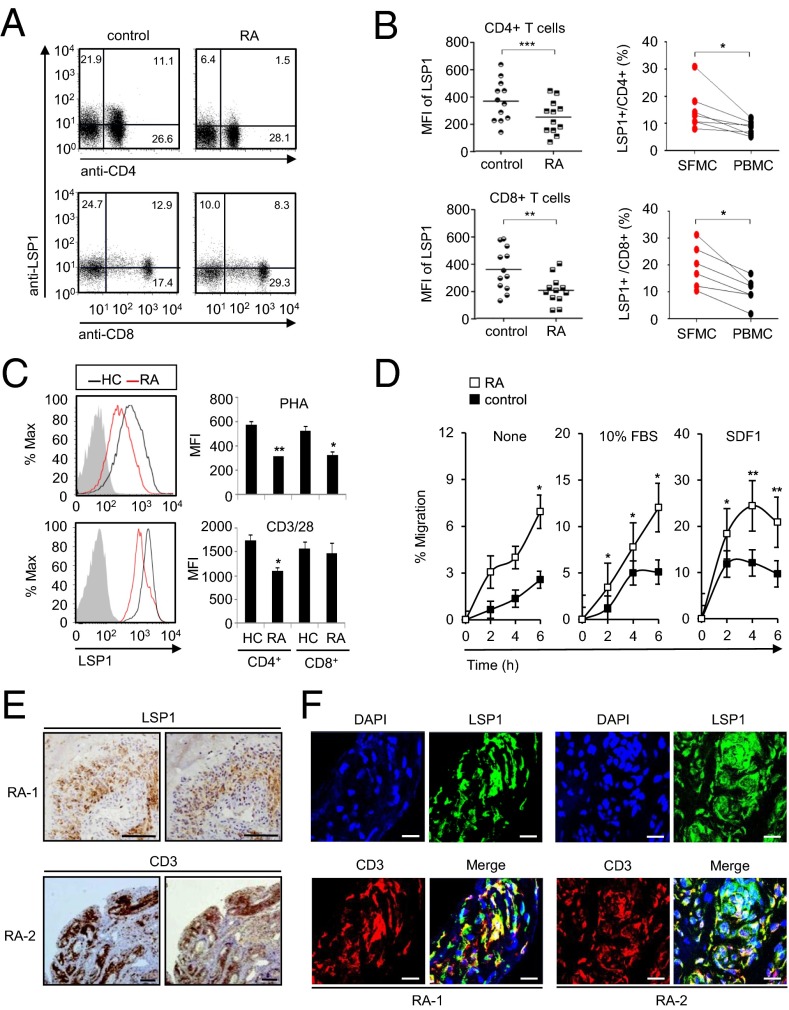
Copy number variations (CNVs) have been implicated in human diseases. However, it remains unclear how they affect immune dysfunction and autoimmune diseases, including rheumatoid arthritis (RA). Here, we identified a novel leukocyte-specific protein 1 (LSP1) deletion variant for RA susceptibility located in 11p15.5. We replicated that the copy number of LSP1 gene is significantly lower in patients with RA, which correlates positively with LSP1 protein expression levels. Differentially expressed genes in Lsp1-deficient primary T cells represent cell motility and immune and cytokine responses. Functional assays demonstrated that LSP1, induced by T-cell receptor activation, negatively regulates T-cell migration by reducing ERK activation in vitro. In mice with T-cell-dependent chronic inflammation, loss of Lsp1 promotes migration of T cells into the target tissues as well as draining lymph nodes, exacerbating disease severity. Moreover, patients with RA show diminished expression of LSP1 in peripheral T cells with increased migratory capacity, suggesting that the defect in LSP1 signaling lowers the threshold for T-cell activation. To our knowledge, our work is the first to demonstrate how CNVs result in immune dysfunction and a disease phenotype. Particularly, our data highlight the importance of LSP1 CNVs and LSP1 insufficiency in the pathogenesis of RA and provide previously unidentified insights into the mechanisms underlying T-cell migration toward the inflamed synovium in RA.

Keywords: T-cell function; cell migration; copy number variation; leukocyte-specific protein 1; rheumatoid arthritis.


Conflict of interest statement

The authors declare no conflict of interest.

Figures

Fig. 1.
Fig. 1.
LSP1 copy number and LSP1 expression profiles in patients with RA. (A) Frequency distribution of LSP1 genomic copy number. (Left) Distribution patterns of LSP1 copy numbers in patients with RA (solid bar; n = 599) and normal controls (open bar; n = 966) from Korea. (Middle) Distribution patterns of LSP1 copy numbers in white patients with RA (solid bar; n = 165) and normal controls (open bar; n = 258) from the United States. (Right) Overall distribution patterns of LSP1 copy numbers from Korea and the United States (*P < 0.05 and **P < 0.001). (B) LSP1 expression in PBMCs of patients with RA and healthy controls. A ratio of LSP1 protein expression relative to GAPDH protein (LSP1/GAPDH) was measured by Western blot analysis. (C) Correlation between LSP1 protein expression level and the copy number status of LSP1 gene in PBMCs of RA and control groups.
Fig. 2.
Fig. 2.
LSP1 inhibition of T-cell migration. (A) Hierarchical clustering of DEGs in the two comparisons: Lsp1(−/−)/Lsp1(+/+) without anti-CD3/28 Abs (first column) or Lsp1(−/−)/Lsp1(+/+) with anti-CD3/28 Abs (second column). After hierarchical clustering using Euclidean distance as a dissimilarity measure and complete linkage method, we identified eight clusters (C1-C8) that reflect all possible combinations of up-regulation (red) and down-regulation (green) patterns of the DEGs in the two comparisons (SI Appendix, Table S3). The numbers in parentheses show the number of DEGs in each cluster. Color bar indicates the gradient of log2 fold change. (B) Heat map shows Gene Ontology biological processes (GOBPs) and Kyoto Encyclopedia of Genes and Genomes (KEGG) pathways represented by up- or down-regulated genes in Lsp1(−/−) T cells, compared with Lsp1(+/+) T cells, in the absence and presence of anti-CD3/28 Abs. Color bar indicates gradient of Z score N−1(1 − P) where P is P value computed by DAVID and N−1(⋅) is the inverse standard normal distribution. Migration-related GOBPs or KEGG pathways are labeled in red. (C) In vitro migration of CD4+ T cells (5 × 10⁵ cells) obtained from the spleens of Lsp1-deficient (n = 5) and WT mice (n = 5). Migration assays were performed in transwell chambers in the presence or absence of SDF1α (100 ng/mL) or 10% (vol/vol) FBS in triplicate. The results are the mean ± SD. Expression of CXCR4 (a specific SDF1 receptor) determined by flow cytometry is presented on the right. Gray-colored histogram indicates isotype control. (D) Suppression of SDF1-induced T-cell migration by LSP1 overexpression. Human recombinant SDF1α (100 ng/mL), MCP-1 (100 ng/mL), IL-6 (100 ng/mL), or 10% FBS was added to the lower chamber of the transwell inserts. The Jurkat T cells (1 × 10⁶ cells) were loaded to the upper chamber and allowed to migrate for 4 h. The number of migrated cells were counted manually (Left) or determined by flow cytometry analysis (Right).
Fig. 3.
Fig. 3.
LSP1 control of pERK activity for T-cell migration. (A) pERK expression in LSP1-overexpressing T cells. Jurkat T cells, stably overexpressed with LSP1 gene (LSP1-GFP), were stimulated with anti-CD3 Ab (2 μg/mL) plus anti-CD28 Ab (2 μg/mL) or SDF1α (100 ng/mL) for 30 min. The cells with GFP only were used as a control. A representative of three independent experiments is shown. (B) Decrease in pERK expression in LSP1-overexpressing T cells. The cells were stimulated with anti-CD3/CD28 or SDF1 for 15 min. Data are the representative histogram of the three independent experiments with a similar result; red curve indicates stimulated T cells, black curve represents unstimulated T cells stained with Alexa Fluor 647-labeled pERK Ab, and gray curve shows the isotype control. (C) Increase in pERK expression in Lsp1-deficient T cells. T cells were isolated from spleen of Lsp1-deficient [i.e., (−/−)] and WT mice and stimulated with anti-CD3/CD28 for 20 min. The pERK expression was determined by Western blot analysis. A ratio of pERK1/2 relative to total Erk1/2 expression is presented on the right (*P < 0.05). (D) Immunoprecipitation assay to detect LSP1 binding to pERK. LSP1-overexpressing or control Jurkat T cells were stimulated with anti-CD3/CD28 for 10 min. After cells were incubated with pERK Ab, the LSP1-pERK complexes were precipitated by centrifugation and detected with anti-LSP1 Ab. (E) PD98059 inhibition of SDF1-induced T-cell migration. Splenic T cells were isolated from Lsp1-deficient (−/−) and WT mice and stimulated with SDF1α (100 ng/mL) in the presence or absence of PD98059 (2 μM), an ERK inhibitor. Cell migration was assessed in transwell chambers. Data are the mean ± SD of five independent experiments. Cell viability (Insets) was determined by MTT assay. (F) qPCR assays for representative DEGs regulated by ERK-downstream TFs in Lsp1-deficient [i.e., (−/−)] T cells (Upper) and in Jurkat T cells (Lower), which were stimulated with anti-CD3/28 Abs for 6 h and 12 h, respectively.
Fig. 4.
Fig. 4.
Enhanced inflammation and T-cell migration in Lsp1-deficient mice with DTH. (A) Increased foot thickness in Lsp1-deficient mice. Lsp1-deficient (n = 15) and WT mice (n = 15) were sensitized s.c. with mBSA (200 μg) plus complete Freund's adjuvant (CFA). One week after sensitization, mBSA (100 μg) was injected again into the footpads of each mouse. Footpad thickness was measured 24 h after the second challenge (***P < 0.005 vs. WT mice). (B and C) Histology of footpads of mice with DTH reaction. Sections of footpads challenged with solvent only (Left) or mBSA (Middle and Right) were stained with H&E (Upper) or anti-CD3 Ab (Lower). (B) Representative with significantly increased T-cell infiltration in the epidermis and dermis identified in Lsp1-deficient mice (C). (Scale bar: 100 μm.) Simultaneously, mBSA-specific IgG levels in the sera were determined by ELISA (Bottom). (D) Increase in the number of CD4+ T cells in lymph nodes of Lsp1-deficient mice. The proportion of CD4+ cells in the spleen and lymph node was determined by flow cytometry 7 d after the second antigen challenge. Representative dot plots are shown (Bottom). (E and F) Migration of antigen-activated CD4+ T cells (5 × 10⁵ cells), which were obtained from the spleen and lymph node of Lsp1-deficient and WT mice with DTH. The number of migrated cells was counted manually. Data are the mean ± SEM of three independent experiments (*P < 0.05 and **P < 0.01 vs. WT mice).
Fig. 5.
Fig. 5.
Aggravation of AIA in Lsp1-deficient mice. (A) Increase in ankle swelling in Lsp1-deficient mice. AIA was induced in Lsp1-deficient (n = 10) and WT mice (n = 10), which had been already sensitized twice with mBSA plus CFA, by injection of mBSA into the ankle joints. Footpad and ankle diameters were measured by using microcalipers at days 1 and 3 after the intraarticular injection. (B) Levels of serum anti-mBSA Ab (IgG) determined by ELISA 7 d after AIA induction. Data are expressed in OD units. (C and D) Increase in T-cell infiltration in Lsp1-deficient mice. Seven days after AIA induction, ankle joints were removed and stained with H&E (Left) and anti-CD3 Ab (Right). Lsp1-deficient mice showed increased infiltration of mononuclear leukocytes, including T cells, in the synovial membrane and joint space, compared with WT mice. Data are the mean ± SEM of three independent experiments (*P < 0.05, **P < 0.01, and ***P < 0.005 vs. WT mice). (Scale bar: 100 μm.)
Fig. 6.
Fig. 6.
Decreased LSP1 expression in RA T cells. (A) Representative dot plots show LSP1 expression in the CD4+ and CD8+ T cells of healthy controls and patients with RA. PBMCs were stained with PE-labeled anti-CD4 Ab or APC-labeled anti-CD8 Ab, and then stained again with FITC-conjugated anti-LSP1 Ab. (B) LSP1 expression in T cells of patients with RA and healthy controls as determined by flow cytometry. (Left) Comparison of LSP1 expression in peripheral T cells between healthy controls (n = 12) and patients with RA (n = 12). (Right) Comparison of frequency of LSP1-expressing T cells between synovial fluid mononuclear cells (SFMCs; n = 7) and PBMCs (n = 7), which were obtained simultaneously from each patient with RA (*P < 0.05, **P < 0.01, and ***P < 0.001). (C) LSP1 induction in T cells of patients with RA (n = 4) vs. healthy controls (HC; n = 4) when stimulated with PHA (5 μg/mL) for 12 h or stimulated with anti-CD3 Ab plus anti-CD28 Ab for 48 h. Gray-colored histogram indicates isotype control (*P < 0.05 and **P < 0.01). (D) Increased T-cell migration in patients with RA. T cells were isolated from PBMCs of patients with RA (n = 6) and healthy controls (n = 6) by using anti-CD3 magnetic beads and incubated in transwell chambers in the presence or absence of 10% FBS or SDF1 (100 ng/mL). The number of migrated cells was counted manually. Data are the mean ± SEM (*P < 0.05 and **P < 0.01). (E) Immunohistochemical staining of RA synovia (RA-1 and RA-2) using anti-LSP1 Ab or anti-CD3 Ab. (Scale bar: 100 μm.) (F) Double immunofluorescence staining of RA synovia (RA-1 and RA-2) was performed by using Abs against LSP1 or CD3. Sections were stained subsequently with Cy3-conjugated anti-IgG (red) for anti-CD3 Ab and Alexa 488-conjugated anti-IgG (green) for anti-LSP1 Ab, respectively. In merged images, LSP1+ cells were costained with anti-CD3 Ab in yellow. In the same images, the nucleus was stained with DAPI in blue. (Scale bars: 20 μm.)

Similar articles

Cited by

References

    1. Franz CM, Jones GE, Ridley AJ. Cell migration in development and disease. Dev Cell. 2002;2(2):153–158. - PubMed
    1. Luster AD, Alon R, von Andrian UH. Immune cell migration in inflammation: Present and future therapeutic targets. Nat Immunol. 2005;6(12):1182–1190. - PubMed
    1. McInnes IB, Schett G. The pathogenesis of rheumatoid arthritis. N Engl J Med. 2011;365(23):2205–2219. - PubMed
    1. Tran CN, Lundy SK, Fox DA. Synovial biology and T cells in rheumatoid arthritis. Pathophysiology. 2005;12(3):183–189. - PMC - PubMed
    1. Beech JT, et al. T-cell contact-dependent regulation of CC and CXC chemokine production in monocytes through differential involvement of NFkappaB: implications for rheumatoid arthritis. Arthritis Res Ther. 2006;8(6):R168. - PMC - PubMed

Publication types

MeSH terms

Substances