Down-Regulation of Nucleolar and Spindle-Associated Protein 1 (NUSAP1) Expression Suppresses Tumor and Cell Proliferation and Enhances Anti-Tumor Effect of Paclitaxel in Oral Squamous Cell Carcinoma
- PMID: 26554377
- PMCID: PMC4640814
- DOI: 10.1371/journal.pone.0142252
Down-Regulation of Nucleolar and Spindle-Associated Protein 1 (NUSAP1) Expression Suppresses Tumor and Cell Proliferation and Enhances Anti-Tumor Effect of Paclitaxel in Oral Squamous Cell Carcinoma
Abstract
Background: Nucleolar and spindle-associated protein 1 (NUSAP1) is an important mitotic regulator. In addition to its crucial function in mitosis, NUSAP1 has recently received attention due to the interesting roles in carcinogenesis. The aim of this study was to reveal functional mechanisms of NUSAP1 in oral squamous cell carcinoma (OSCC).
Methods: mRNA and protein expression levels of NUSAP1 in 9 OSCC-derived cells were analyzed by quantitative reverse transcriptase-polymerase chain reaction (qRT-PCR) and immunoblotting analyses. The correlation between the NUSAP1 expression profile and the clinicopathological factors was evaluated by immunohistochemistry (IHC) in clinical OSCC samples (n = 70). The NUSAP1 knockdown cells were established with short hairpin RNA (shRNA) in OSCC cells, and functional assays were performed using these cells. In addition to the evaluation of cellular proliferation and cell cycle, we also investigated the potential role of NUSAP1 in paclitaxel (PTX)-induced cellular responses.
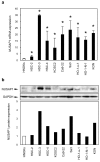
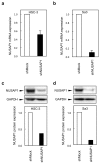
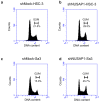
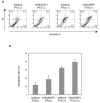
Results: mRNA and protein expression of NUSAP1 were significantly up-regulated in OSCC-derived cells compared with human normal oral keratinocytes (P < 0.05). IHC revealed that NUSAP-1 expression is closely associated with primary advanced T stage (P<0.05). Suppression of NUSAP1 expression levels led to significant (P < 0.05) inhibition of cellular proliferation. Furthermore, apoptosis induced by PTX was enhanced in NUSAP1 knockdown OSCC cells.
Conclusions: NUSAP1 may be a crucial biomarker for OSCC. Moreover, down-regulated NUSAP1 expression suppresses tumor proliferation and also enhances anti-tumor effect of PTX by activating apoptotic pathways. Thus, the present study strongly suggests that regulating NUSAP1 expression should contribute to the therapy for OSCC.
Conflict of interest statement
Figures


Similar articles
-
Downregulation of SRSF3 by antisense oligonucleotides sensitizes oral squamous cell carcinoma and breast cancer cells to paclitaxel treatment.Cancer Chemother Pharmacol. 2019 Nov;84(5):1133-1143. doi: 10.1007/s00280-019-03945-9. Epub 2019 Sep 12. Cancer Chemother Pharmacol. 2019. PMID: 31515668
-
Up-regulation of survivin in oral squamous cell carcinoma correlates with poor prognosis and chemoresistance.Oral Surg Oral Med Oral Pathol Oral Radiol Endod. 2010 Oct;110(4):484-91. doi: 10.1016/j.tripleo.2010.04.009. Oral Surg Oral Med Oral Pathol Oral Radiol Endod. 2010. PMID: 20868995
-
Knocking-down of CREPT prohibits the progression of oral squamous cell carcinoma and suppresses cyclin D1 and c-Myc expression.PLoS One. 2017 Apr 3;12(4):e0174309. doi: 10.1371/journal.pone.0174309. eCollection 2017. PLoS One. 2017. PMID: 28369091 Free PMC article.
-
Pathways Related to the Anti-Cancer Effects of Metabolites Derived from Cerrado Biome Native Plants: An Update and Bioinformatics Analysis on Oral Squamous Cell Carcinoma.Protein Pept Lett. 2021;28(7):735-749. doi: 10.2174/0929866527999201209221012. Protein Pept Lett. 2021. PMID: 33302827 Review.
-
Proliferation and Apoptosis Pathways and Factors in Oral Squamous Cell Carcinoma.Int J Mol Sci. 2022 Jan 29;23(3):1562. doi: 10.3390/ijms23031562. Int J Mol Sci. 2022. PMID: 35163485 Free PMC article. Review.
Cited by
-
Hepatitis B virus X protein enhances hepatocarcinogenesis by depressing the targeting of NUSAP1 mRNA by miR-18b.Cancer Biol Med. 2019 May;16(2):276-287. doi: 10.20892/j.issn.2095-3941.2018.0283. Cancer Biol Med. 2019. PMID: 31516748 Free PMC article.
-
Genome-wide Analyses on Single Disease Samples for Potential Biomarkers and Biological Features of Molecular Subtypes: A Case Study in Gastric Cancer.Int J Biol Sci. 2018 May 22;14(8):833-842. doi: 10.7150/ijbs.24816. eCollection 2018. Int J Biol Sci. 2018. PMID: 29989098 Free PMC article.
-
An 8-gene signature for prediction of prognosis and chemoresponse in non-small cell lung cancer.Oncotarget. 2016 Dec 27;7(52):86561-86572. doi: 10.18632/oncotarget.13357. Oncotarget. 2016. PMID: 27863408 Free PMC article.
-
O-GlcNAcylation Enhances NUSAP1 Stability and Promotes Bladder Cancer Aggressiveness.Onco Targets Ther. 2021 Jan 15;14:445-454. doi: 10.2147/OTT.S258175. eCollection 2021. Onco Targets Ther. 2021. PMID: 33488099 Free PMC article.
-
MicroRNA-769-5p suppresses cell growth and migration via targeting NUSAP1 in bladder cancer.J Clin Lab Anal. 2020 May;34(5):e23193. doi: 10.1002/jcla.23193. Epub 2020 Jan 3. J Clin Lab Anal. 2020. Retraction in: J Clin Lab Anal. 2023 Apr;37(8):e24893. doi: 10.1002/jcla.24893. PMID: 31901150 Free PMC article. Retracted.
References
-
- Sudbo J, Reith A. The evolution of predictive oncology and molecular-based therapy for oral cancer prevention. Int J Cancer 2005,115:339–345 - PubMed
-
- Mashberg A, Boffetta P, Winkelman R, Garfinkel L. Tobacco smoking, alcohol drinking, and cancer of the oral cavity and oropharynx among U.S. veterans. Cancer 1993,72:1369–1375. - PubMed
-
- Fearon ER, Vogelstein B. A genetic model for colorectal tumorigenesis. Cell 1996,61:759–767. - PubMed
-
- Macfarlane GJ, Zheng T, Marshall JR, Boffetta P, Niu S. Alcohol, tobacco, diet and the risk of oral cancer: A pooled analysis of three case-control studies. European Journal of Cancer Part B: Oral Oncology 1995,31:181–187. - PubMed
-
- Marshall CJ. Tumor suppressor genes. Cell. 1991,64:313–326. - PubMed
MeSH terms
Substances
LinkOut - more resources
Full Text Sources
Other Literature Sources
Medical
Research Materials

