

Serum Lipids and Breast Cancer Risk: A Meta-Analysis of Prospective Cohort Studies
- PMID: 26554382
- PMCID: PMC4640529
- DOI: 10.1371/journal.pone.0142669
Serum Lipids and Breast Cancer Risk: A Meta-Analysis of Prospective Cohort Studies
Abstract
Purpose: Epidemiologic studies exploring causal associations between serum lipids and breast cancer risk have reported contradictory results. We conducted a meta-analysis of prospective cohort studies to evaluate these associations.
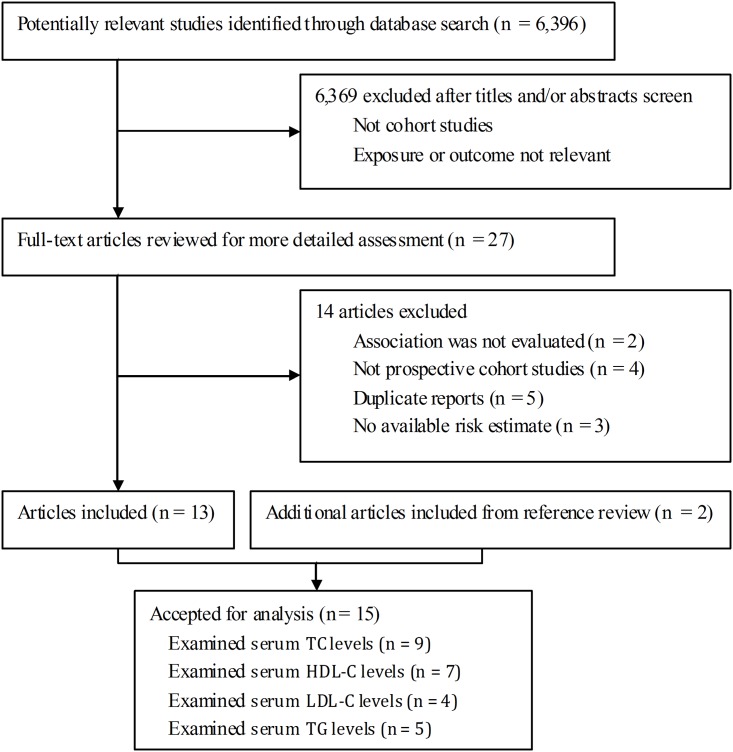
Methods: Relevant studies were identified by searching PubMed and EMBASE through April 2015. We included prospective cohort studies that reported relative risk (RR) estimates with 95% confidence intervals (CIs) for the associations of specific lipid components (i.e., total cholesterol [TC], high-density lipoprotein cholesterol [HDL-C], low-density lipoprotein cholesterol [LDL-C], and triglycerides [TG]) with breast cancer risk. Either a fixed- or a random-effects model was used to calculate pooled RRs.
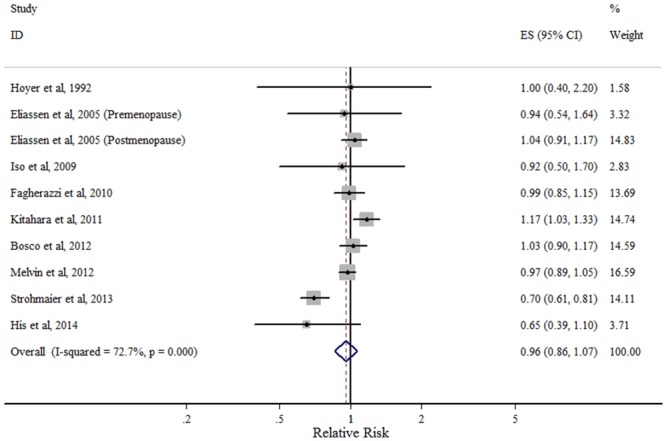
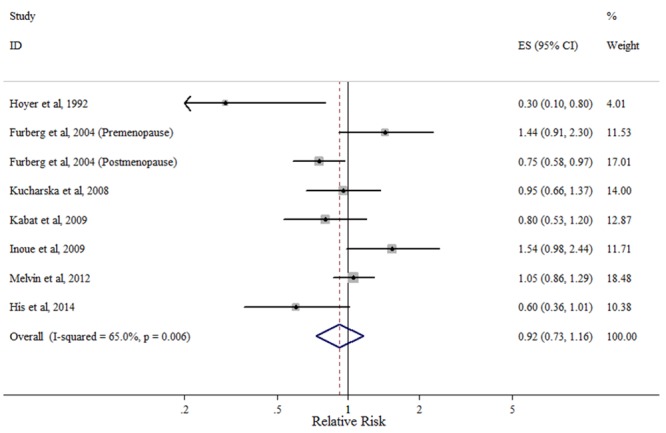
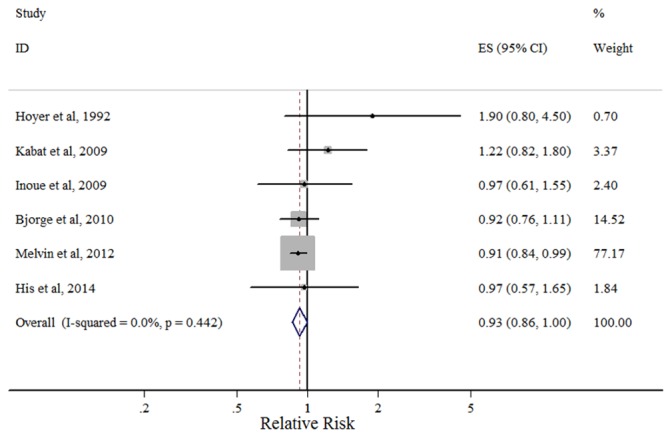
Results: Fifteen prospective cohort studies involving 1,189,635 participants and 23,369 breast cancer cases were included in the meta-analysis. The pooled RRs of breast cancer for the highest versus lowest categories were 0.96 (95% CI: 0.86-1.07) for TC, 0.92 (95% CI: 0.73-1.16) for HDL-C, 0.90 (95% CI: 0.77-1.06) for LDL-C, and 0.93 (95% CI: 0.86-1.00) for TG. Notably, for HDL-C, a significant reduction of breast cancer risk was observed among postmenopausal women (RR = 0.77, 95% CI: 0.64-0.93) but not among premenopausal women. Similar trends of the associations were observed in the dose-response analysis.
Conclusions: Our findings suggest that serum levels of TG but not TC and LDL-C may be inversely associated with breast cancer risk. Serum HDL-C may also protect against breast carcinogenesis among postmenopausal women.
Conflict of interest statement
Figures

References
-
- Smith DG. Epidemiology of dyslipidemia and economic burden on the healthcare system. The Am J Manag Care. 2007; 13 Suppl 3: S68–71. - PubMed
-
- Eliassen AH, Hankinson SE. Endogenous hormone levels and risk of breast, endometrial and ovarian cancers: prospective studies. Adv Exp Med Biol. 2007; 630: 148–165. - PubMed
-
- Hoyer AP, Engholm G. Serum lipids and breast cancer risk: a cohort study of 5,207 Danish women. Cancer Causes Control. 1992; 3: 403–408. - PubMed
Publication types
MeSH terms
Substances
LinkOut - more resources
Full Text Sources
Other Literature Sources
Medical
Miscellaneous
