. 2015 Dec 22;6(41):43853-68.
doi: 10.18632/oncotarget.6081.

p21-activated kinase group II small compound inhibitor GNE-2861 perturbs estrogen receptor alpha signaling and restores tamoxifen-sensitivity in breast cancer cells

Affiliations

p21-activated kinase group II small compound inhibitor GNE-2861 perturbs estrogen receptor alpha signaling and restores tamoxifen-sensitivity in breast cancer cells

Ting Zhuang et al. Oncotarget. .

Abstract

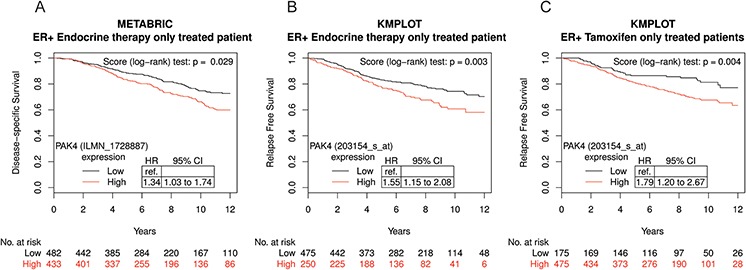
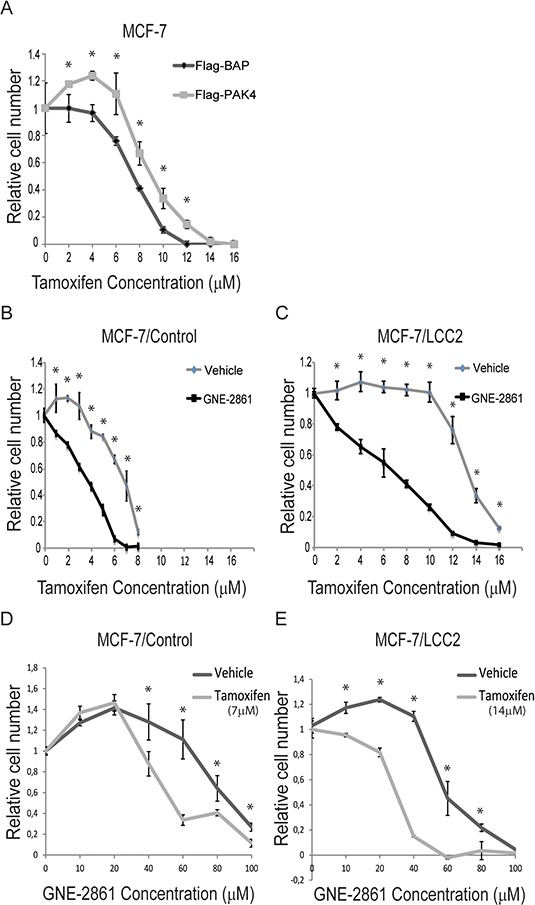
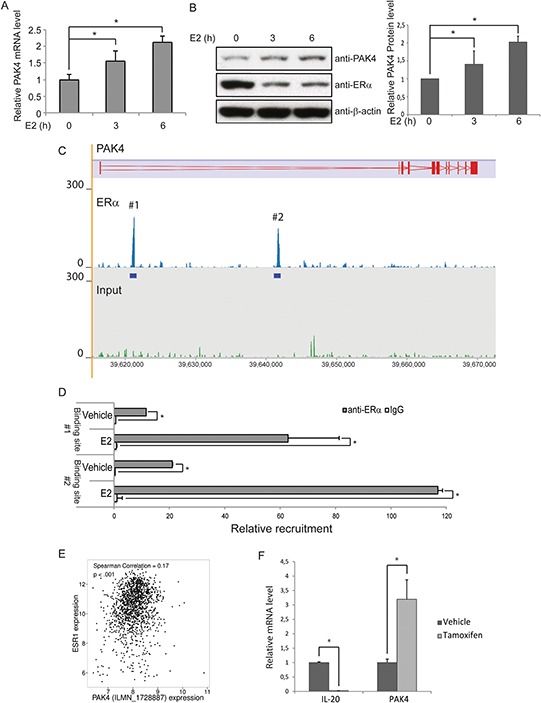
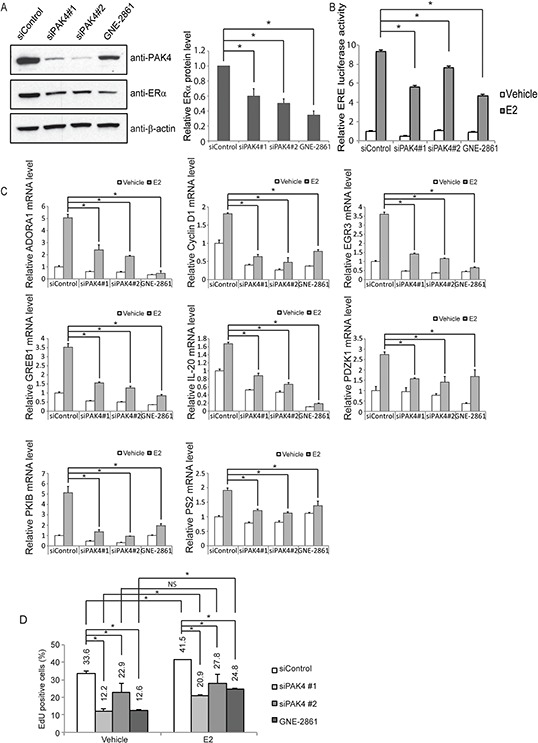
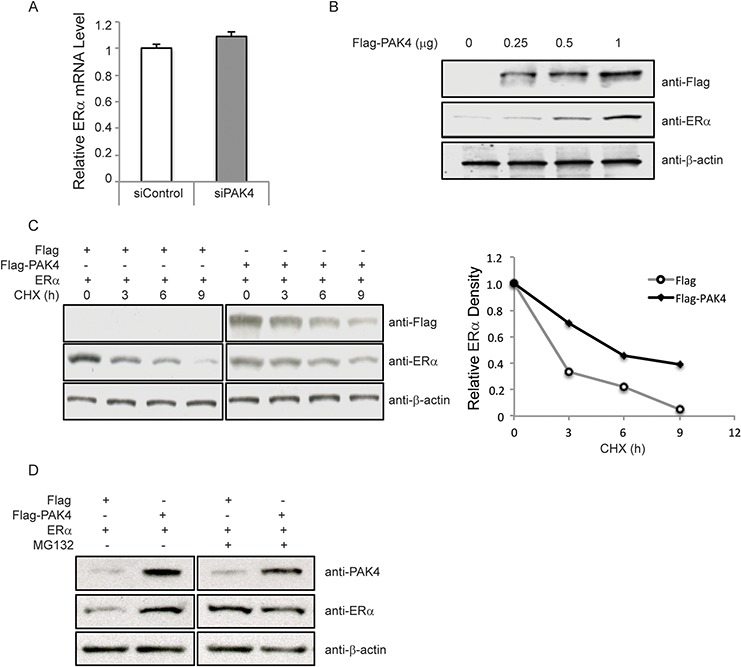
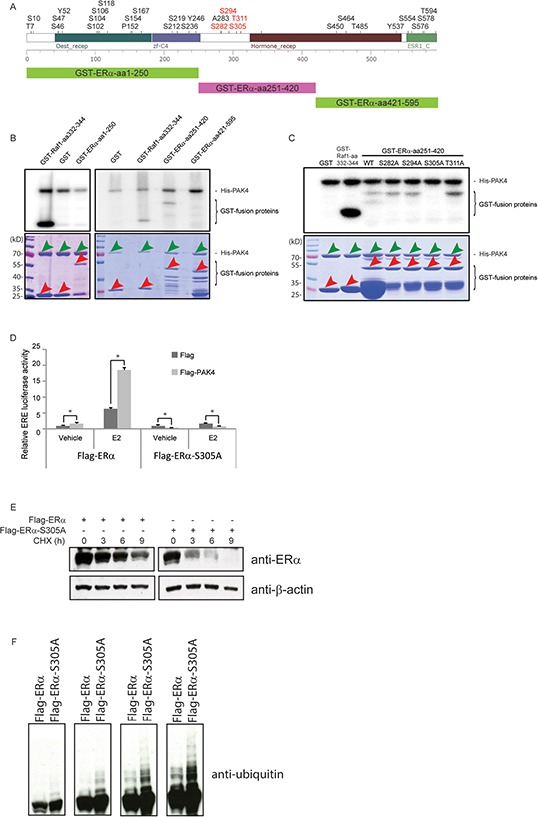
Estrogen receptor alpha (ERα) is highly expressed in most breast cancers. Consequently, ERα modulators, such as tamoxifen, are successful in breast cancer treatment, although tamoxifen resistance is commonly observed. While tamoxifen resistance may be caused by altered ERα signaling, the molecular mechanisms regulating ERα signaling and tamoxifen resistance are not entirely clear. Here, we found that PAK4 expression was consistently correlated to poor patient outcome in endocrine treated and tamoxifen-only treated breast cancer patients. Importantly, while PAK4 overexpression promoted tamoxifen resistance in MCF-7 human breast cancer cells, pharmacological treatment with a group II PAK (PAK4, 5, 6) inhibitor, GNE-2861, sensitized tamoxifen resistant MCF-7/LCC2 breast cancer cells to tamoxifen. Mechanistically, we identified a regulatory positive feedback loop, where ERα bound to the PAK4 gene, thereby promoting PAK4 expression, while PAK4 in turn stabilized the ERα protein, activated ERα transcriptional activity and ERα target gene expression. Further, PAK4 phosphorylated ERα-Ser305, a phosphorylation event needed for the PAK4 activation of ERα-dependent transcription. In conclusion, PAK4 may be a suitable target for perturbing ERα signaling and tamoxifen resistance in breast cancer patients.

Keywords: ERα; PAK4; phosphorylation; small molecule inhibitor; tamoxifen resistance.


Conflict of interest statement

CONFLICTS OF INTEREST

The authors declare that they have no competing interests.

Figures

Figure 1
Figure 1. High PAK4 mRNA expression levels correlate with poor survival of endocrine-treated breast cancer patients
A. Kaplan-Meier plot of disease-specific survival in ER+, endocrine therapy only treated patients in the Metabric database stratified for high (red) and low (black) PAK4 expression levels (n = 915; median cut-off; Probe ILMN_1728887: HR = 1.34; 95% CI: 1.03–1.74; P = 0.029). B. Kaplan-Meier plot showing that high PAK4 expression correlates with relapse free survival in ER+, endocrine therapy only treated patients in the KMplot database stratified for high (red) and low (black) PAK4 expression levels (n = 725; optimized cut-off; Probe 203154_s_at: HR = 1.55; 95% CI: 1.15–2.08; P = 0.003). C. Kaplan-Meier plot showing that high PAK4 expression correlates with relapse free survival in ER+, tamoxifen-only treated patients in the KMplot database stratified for high (red) and low (black) PAK4 expression levels (n = 650; optimized cut-off; Probe 203154_s_at: HR = 1.79; 95% CI: 1.20–2.67; P = 0.004).
Figure 2
Figure 2. The group II PAK inhibitor GNE-2861 restores tamoxifen-sensitivity in breast cancer cells
A. PAK4 overexpression inhibits the tamoxifen-response in MCF-7 ERα positive human breast cancer cells. MCF-7 cells with stable transfection of Flag-PAK4 or Flag-BAP control were treated with the indicated tamoxifen concentrations for 48 h and the number of cells was quantified by a WST-1 assay. Shown values represent mean ± s.d. (n = 3) for each concentration, representative for three independent experiments. * - P < 0.05 compared to control, according to t-test. B–C. The group II PAK inhibitor GNE-2861 sensitizes breast cancer cells to tamoxifen treatment. B) MCF-7/Control cells and C) MCF-7/LCC2 tamoxifen resistant cells were treated with vehicle or 50 μM GNE-2861. In addition, each group of cells was treated with the indicated concentrations of tamoxifen for 48 h and the number of cells was quantified by a WST-1 assay. Shown values represent mean ± s.d. (n = 3) for each concentration, representative for three independent experiments. * - P < 0.05 compared to control, according to t-test. D–E. Tamoxifen sensitizes breast cancer cells to GNE-2861 treatment. D) MCF-7/Control cells were treated with vehicle or 7 μM tamoxifen. E) MCF-7/LCC2 tamoxifen resistant cells were treated with vehicle or 14 μM tamoxifen. In addition, each group of cells was treated with the indicated concentrations of GNE-2861 for 48 h and the number of cells was quantified by a WST-1 assay. Shown values represent mean ± s.d. (n = 3) for each concentration, based on three independent experiments. * - P < 0.05 compared to control, according to t-test.
Figure 3
Figure 3. ERα binds to the PAK4 gene and promotes PAK4 expression
A–B. Induction of PAK4 mRNA and protein by E2. Serum-starved MCF-7 cells were treated with10 nM E2 for up to 6 h. A) The levels of PAK4 mRNA were assessed by qPCR, using 36B4 as an internal control. B) Left: The protein levels were determined by immunoblotting, using β-actin as a loading control. Right: Quantification of PAK4 signal in the immunoblot. Shown values represent mean ± s.d. (n = 3). * - P < 0.05 compared to control, according to t-test. C. ChIP-seq results show the ERα binding peaks within the PAK4 gene locus after E2 treatment. The PAK4 gene is represented in the top track. ERα ChIP-seq signal is shown in the middle track and input ChIP-seq signal in the bottom track. D. ChIP-qPCR analysis confirms the recruitment of ERα to the two regions of the PAK4 gene indicated in C. Data presented are normalized to input DNA and expressed as fold enrichment over IgG. Shown values are mean ± s.d. (n = 3). * - P < 0.05 as compared with IgG controls, according to t-test. E. Positive correlation between ESR1 and PAK4 (probe ILMN_1728887) gene expression in ER+ breast cancer patients in the Metabric database (n = 1394). Spearman correlation = 0.17; P < 0.001. F. Tamoxifen regulation of PAK4 mRNA levels. MCF-7 cells were treated with 1 μM tamoxifen for 12 h. The relative IL-20 (positive control for tamoxifen effect) and PAK4 mRNA levels were assessed by qPCR, using 36B4 as an internal control. Shown values represent mean ± s.d. (n = 3). * - P < 0.05 compared to control, according to t-test.
Figure 4
Figure 4. PAK4 inhibition impairs ERα signaling in MCF-7 cells
A. Left: PAK4 depletion or functional inhibition of group II PAKs reduces ERα protein levels in MCF-7 cells. MCF-7 cells were transfected with siControl or siPAK4 oligos (#1 or #2) for 72 h, or treated with 50 μM GNE-2861 for 24 h. ERα, PAK4 and β-actin levels were determined by immunoblotting. Right: Quantifications of the immunoblot. Shown values represent mean ± s.d. (n = 3). * - P < 0.05 compared to control, according to t-test. B. PAK4 depletion or functional group II PAK inhibition reduces the activity of estrogen receptor-induced signal transduction in MCF-7. MCF-7 cells were transfected with siControl, siPAK4 oligos (#1 or #2), or treated with GNE-2861 as described above. 24 h before measurement, cells were transfected with an ERE luciferase reporter. After 18 h, cells were treated with 10 nM E2 or vehicle, and an ERE-luc luciferase assay was carried out 6 h after E2 addition. Shown values represent mean ± s.d. (n = 3), representative for three independent experiments. * - P < 0.05 compared to control, according to t-test. C. PAK4 depletion or pharmacological group II PAK inhibition decreases the expression of the endogenous ERα target genes ADORA1, Cyclin D1, EGR3, GREB1, IL-20, PDZK1, PKIB, and PS2. MCF-7 cells were transfected with siControl, siPAK4 oligos (#1 or #2), or treated with GNE-2861 as described above. Cells were treated with 10 nM E2 or vehicle for 6 h before harvest and RNA was prepared. The mRNA expression levels of the endogenous ERα target genes were determined by qPCR. Shown are the results from triplicate experiments. Shown values represent mean ± s.d. (n = 3), representative for three independent experiments. * - P < 0.05 compared to control, according to t-test. D. PAK4 depletion or functional group II PAK inhibition impairs cell proliferation in MCF-7 cells. MCF-7 cells were transfected with siControl, siPAK4 oligos (#1 or #2), or treated with GNE-2861 as described above. Cells were then treated with 10 nM E2 or vehicle for 24 h before fixation. EdU was added at a concentration of 10 μM during the last 1 h. The cells were subject to flow cytometry analysis quantifying EdU-positive cells (Supplementary Figure S4). Shown values represent mean ± s.d. (n = 3), which is representative for three independent experiments. * - P < 0.05, NS=not significant, as compared to control, according to t-test.
Figure 5
Figure 5. PAK4 regulates ERα protein stability
A. Depletion of PAK4 does not affect ERα mRNA levels. MCF-7 cells were transfected with control siRNA or PAK4 siRNA (#1 and #2 pool). After 72 h, cells were harvested for analysis. ERα mRNA was measured by qPCR. Shown values represent mean ± s.d. (n = 3). B. Over-expression of PAK4 increases ERα protein levels. MCF-7 cells were transfected with varying amounts of a Flag-PAK4 plasmid, and Flag-PAK4, ERα and β-actin levels were determined by immunoblotting. C. Over-expression of PAK4 increases ERα protein stability. HEK293 cells were transfected with ERα together with Flag-PAK4 or a Flag control plasmid. Cells were treated with 100 μM cycloheximide (CHX) for the indicated times. Flag-PAK4, ERα and β-actin levels were determined by immunoblotting. The relative ERα protein levels were quantified by ImageJ and normalized to the zero time point ERα levels (before CHX treatment). Two-sample Kolmogorov-Smirnov test (two-sample KS-test) of the curve distributions in three distinct experiments yielded a statistically discernable difference between Flag control and Flag-PAK4 (P = 0.03). D. The proteasome inhibitor MG132 increases ERα protein level in a similar manner as PAK4 overexpression. HEK293 cells were transfected with ERα together with Flag-PAK4 or a Flag control plasmid. Forty-eight hours after transfection, cells were treated with 10 μM MG132 for 8 h. ERα, PAK4 and β-actin levels were determined by immunoblot analysis. The results are representative for three independent experiments.
Figure 6
Figure 6. PAK4 regulation of ERα signaling through phosphorylation of ERα-Ser305
A. Upper panel: prediction of phosphorylation modification sites of ERα using the PhosphoSitePlus online tool (http://www.phosphosite.org, accessed on May 2014). The four putative Ser/Thr kinase target sites in ERα aa 251–420 are in red. Lower panel: the three different fragments for which we produced GST-fusion proteins used in B. B. PAK4 phosphorylates the ERα fragment aa 251–420. His-PAK4 phosphorylation of ERα was analyzed by in vitro phosphorylation using recombinant His-PAK4 together with GST-ERα fragments as substrates, using GST alone as a negative control and GST-Raf1-aa332–344 as a positive control (upper panel). The lower panel shows the amounts of His-PAK4 proteins (green arrows) and GST-fusion proteins (red arrows) used in the assay by Coomassie Brilliant Blue gel staining. Bands not demarcated by arrows likely represent degradation products. A size marker is displayed in the left lane of each gel. C. PAK4 phosphorylates ERα at Serine 305. Recombinant His-PAK4 was used as the kinase (green arrows in lower panel), and purified GST-ERα aa 251–420 protein fragments with or without mutations (red arrows in lower panel) were substrates. A GST-Raf1-aa332–344 fusion protein was used as a positive control and GST only was used as a negative control (Also red arrows in lower panel). The upper panel is an autoradiography image, the lower panel is a Coomassie Brilliant Blue staining. D. ERα-Ser305 phosphorylation is necessary for the PAK4 mediated ERα signaling. Flag control or Flag-PAK4 and wild type Flag-ERα or Flag-ERα-S305A were transfected in the indicated combinations in HEK293 cells. 24 h before measurement, cells were transfected with an ERE luciferase reporter. After 18 h, cells were treated with 10 nM E2 or vehicle, and an ERE-luc luciferase assay was carried out 6 h after E2 addition. Shown values represent mean ± s.d. (n = 3), which is representative for three independent experiments. * - P < 0.05 for Flag-PAK4 group versus control, according to t-test. E. ERα-S305A is less stable than wild-type ERα. HEK293 cells were transfected with wild-type Flag-ERα or Flag-ERα-S305A plasmids. Forty-eight hours after transfection, cells were treated with 100 μM cycloheximide (CHX) for the indicated times. ERα and β-actin levels were determined by immunoblotting. The results are representative for three independent experiments. F. ERα-S305A displays stronger ubiquitination than wild-type ERα. HEK293 cells were transfected with wild-type Flag-ERα or Flag-ERα-S305A plasmid. Forty-eight hours after transfection, cells were treated with 10 μM MG132 for 8 h. Ubiquitin were detected by immunoblotting. The panel displays varying exposure times increasing from the left to the right.

Similar articles

Cited by

References

    1. DeSantis C, Ma J, Bryan L, Jemal A. Breast cancer statistics, 2013. CA: a cancer journal for clinicians. 2014;64:52–62. - PubMed
    1. Jakesz R, Smith CA, Aitken S, Huff K, Schuette W, Shackney S, Lippman M. Influence of cell proliferation and cell cycle phase on expression of estrogen receptor in MCF-7 breast cancer cells. Cancer research. 1984;44:619–625. - PubMed
    1. Lin CY, Strom A, Vega VB, Kong SL, Yeo AL, Thomsen JS, Chan WC, Doray B, Bangarusamy DK, Ramasamy A, Vergara LA, Tang S, Chong A, Bajic VB, Miller LD, Gustafsson JA, et al. Discovery of estrogen receptor alpha target genes and response elements in breast tumor cells. Genome biology. 2004;5:R66. - PMC - PubMed
    1. Clarke R, Leonessa F, Welch JN, Skaar TC. Cellular and molecular pharmacology of antiestrogen action and resistance. Pharmacological reviews. 2001;53:25–71. - PubMed
    1. Haagenson KK, Zhang JW, Xu Z, Shekhar MP, Wu GS. Functional analysis of MKP-1 and MKP-2 in breast cancer tamoxifen sensitivity. Oncotarget. 2014;5:1101–1110. - PMC - PubMed

Publication types

MeSH terms

Substances