Increased BST2 expression during simian immunodeficiency virus infection is not a determinant of disease progression in rhesus monkeys
- PMID: 26554913
- PMCID: PMC4641394
- DOI: 10.1186/s12977-015-0219-8
Increased BST2 expression during simian immunodeficiency virus infection is not a determinant of disease progression in rhesus monkeys
Abstract
Background: Bone marrow stromal cell antigen 2 (BST2), also known as tetherin, HM1.24 or CD317 represents a type 2 integral membrane protein, which has been described to restrict the production of some enveloped viruses by inhibiting the virus release from the cell surface. This innate antiviral mechanism is counteracted by the HIV-1 viral factor Vpu, targeting BST2 for cellular degradation. Since antiviral BST2 activity has been mainly confirmed by in vitro data, we investigated its role in vivo on the disease progression using the SIV/macaque model for AIDS. We determined BST2 expression in PBMC and leukocyte subsets of uninfected and SIV-infected rhesus macaques by real-time PCR and flow cytometry and correlated it with disease progression and viral load.
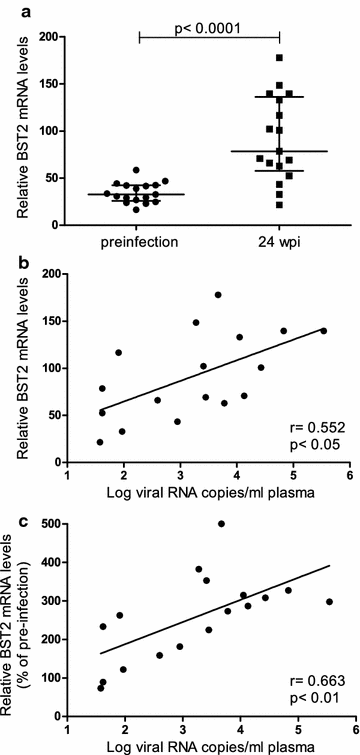
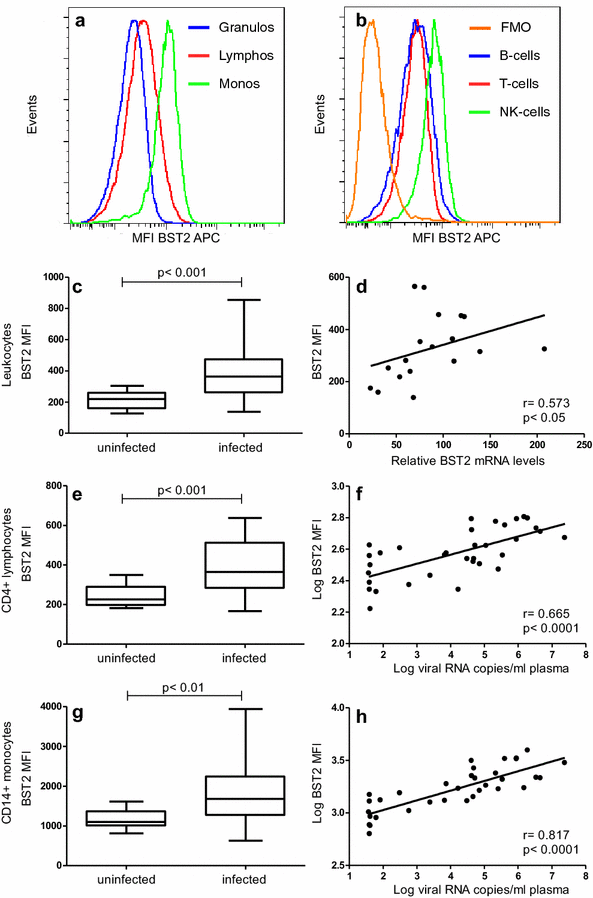
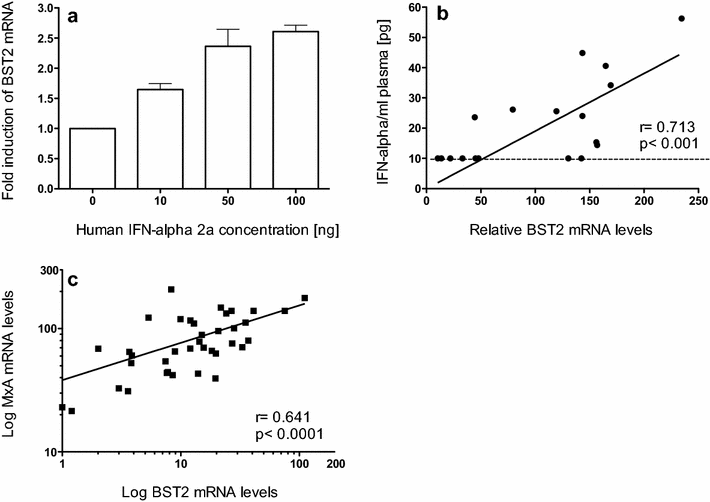
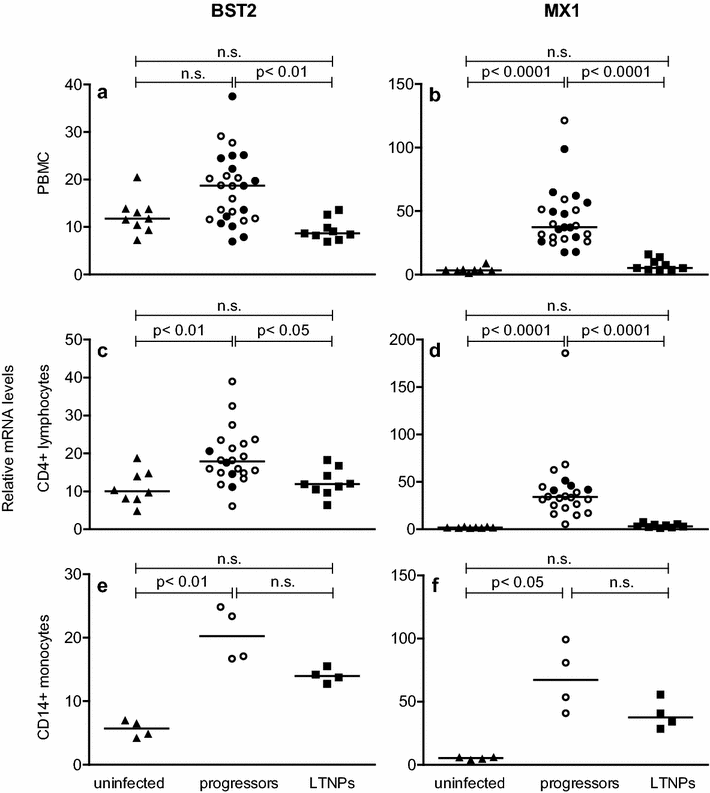
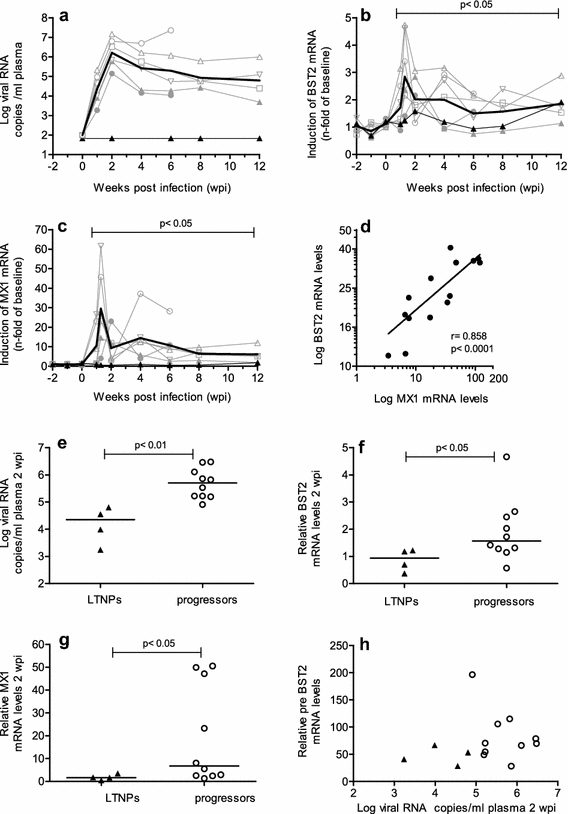
Results: Compared to pre-infection levels, we found increased BST2 expression in PBMC, purified CD4(+) lymphocytes and CD14(+) monocytes of SIV-infected animals, which correlated with viral load. Highest BST2 levels were found in progressors and lowest levels comparable to uninfected macaques were observed in long-term non-progressors (LTNPs). During acute viremia, BST2 mRNA increased in parallel with MX1, a prototype interferon-stimulated gene. This association was maintained during the whole disease course.
Conclusion: The detected relationship between BST2 expression and viral load as well as with MX1 indicate a common regulation by the interferon response and suggest rather limited influence of BST2 in vivo on the disease outcome.
Figures
Similar articles
-
Increased APOBEC3G and APOBEC3F expression is associated with low viral load and prolonged survival in simian immunodeficiency virus infected rhesus monkeys.Retrovirology. 2011 Sep 28;8:77. doi: 10.1186/1742-4690-8-77. Retrovirology. 2011. PMID: 21955401 Free PMC article.
-
Noncytolytic CD8+ Cell Mediated Antiviral Response Represents a Strong Element in the Immune Response of Simian Immunodeficiency Virus-Infected Long-Term Non-Progressing Rhesus Macaques.PLoS One. 2015 Nov 9;10(11):e0142086. doi: 10.1371/journal.pone.0142086. eCollection 2015. PLoS One. 2015. PMID: 26551355 Free PMC article.
-
Influence of Plasma Cell Niche Factors on the Recruitment and Maintenance of IRF4hi Plasma Cells and Plasmablasts in Vaccinated, Simian Immunodeficiency Virus-Infected Rhesus Macaques with Low and High Viremia.J Virol. 2017 Jan 31;91(4):e01727-16. doi: 10.1128/JVI.01727-16. Print 2017 Feb 15. J Virol. 2017. PMID: 27928009 Free PMC article.
-
Multi-functional BST2/tetherin against HIV-1, other viruses and LINE-1.Front Cell Infect Microbiol. 2022 Sep 13;12:979091. doi: 10.3389/fcimb.2022.979091. eCollection 2022. Front Cell Infect Microbiol. 2022. PMID: 36176574 Free PMC article. Review.
-
APOBEC3, TRIM5α, and BST2 polymorphisms in healthy individuals of various populations with special references to its impact on HIV transmission.Microb Pathog. 2022 Jan;162:105326. doi: 10.1016/j.micpath.2021.105326. Epub 2021 Dec 1. Microb Pathog. 2022. PMID: 34863878 Review.
Cited by
-
Epigenetic Regulation of BST-2 Expression Levels and the Effect on HIV-1 Pathogenesis.Front Immunol. 2021 May 5;12:669241. doi: 10.3389/fimmu.2021.669241. eCollection 2021. Front Immunol. 2021. PMID: 34025670 Free PMC article.
-
Mass Cytometry Analysis Reveals Complex Cell-State Modifications of Blood Myeloid Cells During HIV Infection.Front Immunol. 2019 Nov 22;10:2677. doi: 10.3389/fimmu.2019.02677. eCollection 2019. Front Immunol. 2019. PMID: 31824485 Free PMC article.
-
Vector Order Determines Protection against Pathogenic Simian Immunodeficiency Virus Infection in a Triple-Component Vaccine by Balancing CD4+ and CD8+ T-Cell Responses.J Virol. 2017 Nov 14;91(23):e01120-17. doi: 10.1128/JVI.01120-17. Print 2017 Dec 1. J Virol. 2017. PMID: 28904195 Free PMC article.
-
Identification of miRNA-mRNA crosstalk in CD4+ T cells during HIV-1 infection by integrating transcriptome analyses.J Transl Med. 2017 Feb 21;15(1):41. doi: 10.1186/s12967-017-1130-y. J Transl Med. 2017. PMID: 28222782 Free PMC article.
-
T cells with low CD2 levels express reduced restriction factors and are preferentially infected in therapy naïve chronic HIV-1 patients.J Int AIDS Soc. 2017 Sep 19;20(1):21865. doi: 10.7448/IAS.20.1.21865. J Int AIDS Soc. 2017. PMID: 28953327 Free PMC article.
References
MeSH terms
Substances
LinkOut - more resources
Full Text Sources
Other Literature Sources
Research Materials

