. 2015 Nov 9;35(3):366-82.
doi: 10.1016/j.devcel.2015.10.011.

Lineage-Specific Profiling Delineates the Emergence and Progression of Naive Pluripotency in Mammalian Embryogenesis

Affiliations

Lineage-Specific Profiling Delineates the Emergence and Progression of Naive Pluripotency in Mammalian Embryogenesis

Thorsten Boroviak et al. Dev Cell. .

Abstract

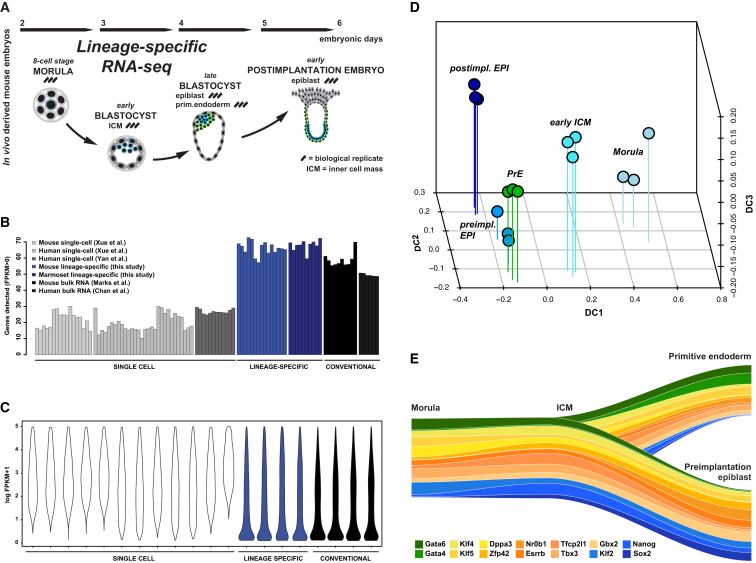
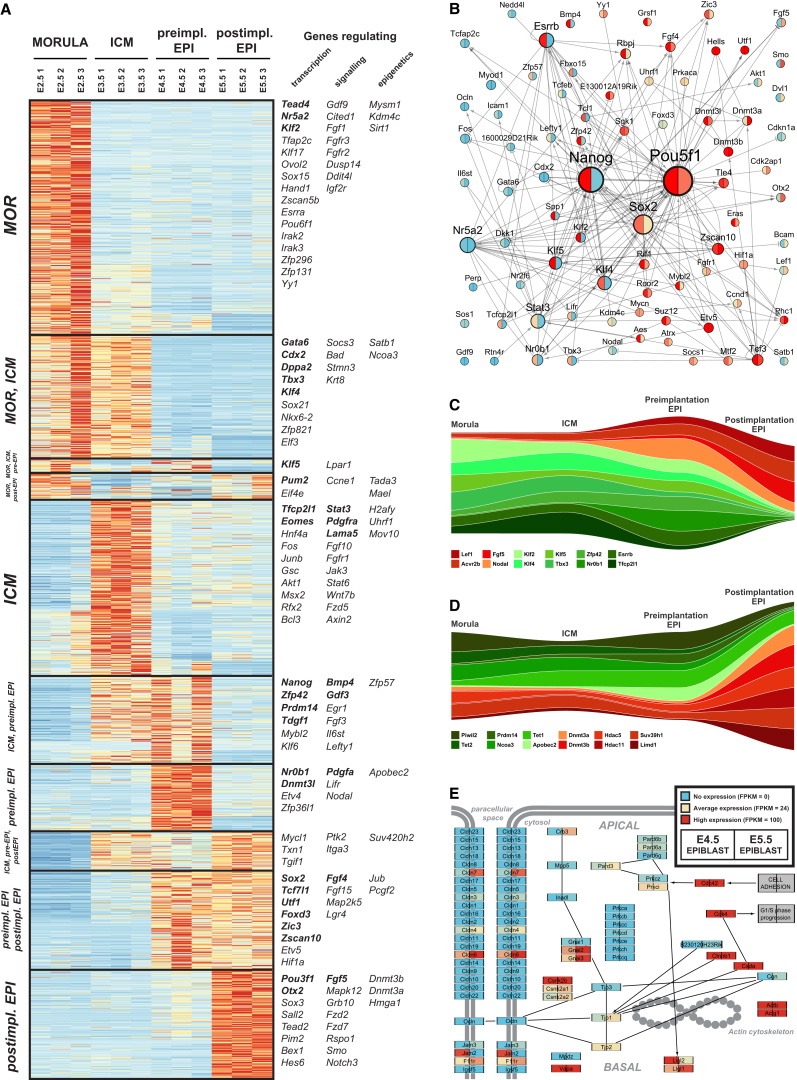
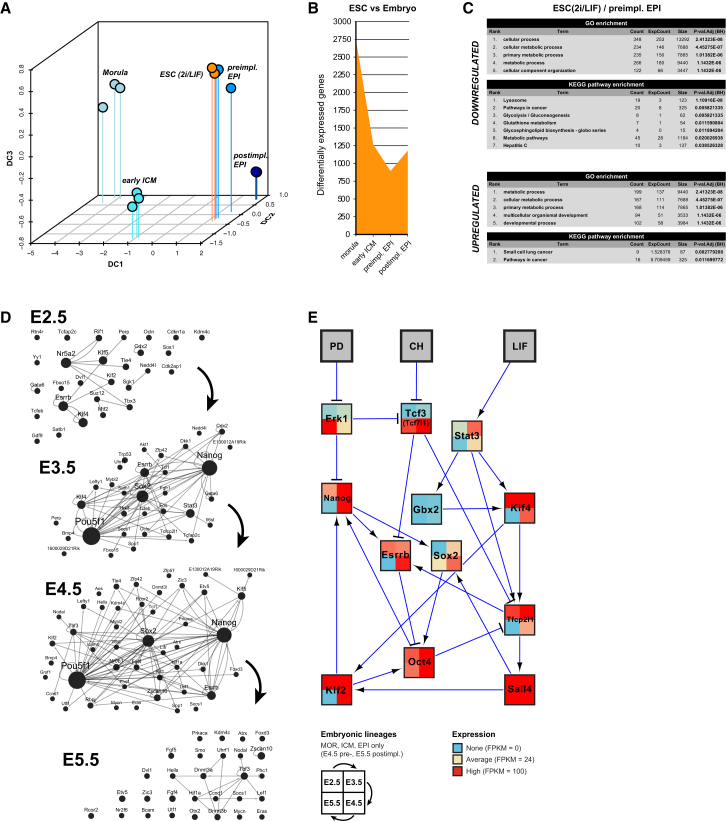
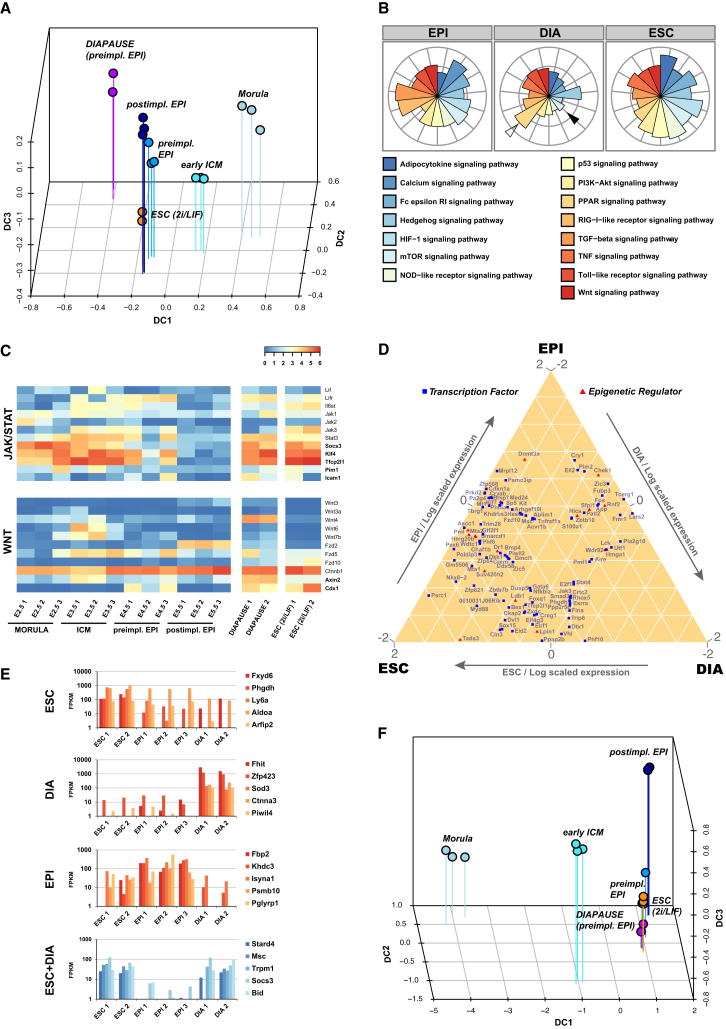
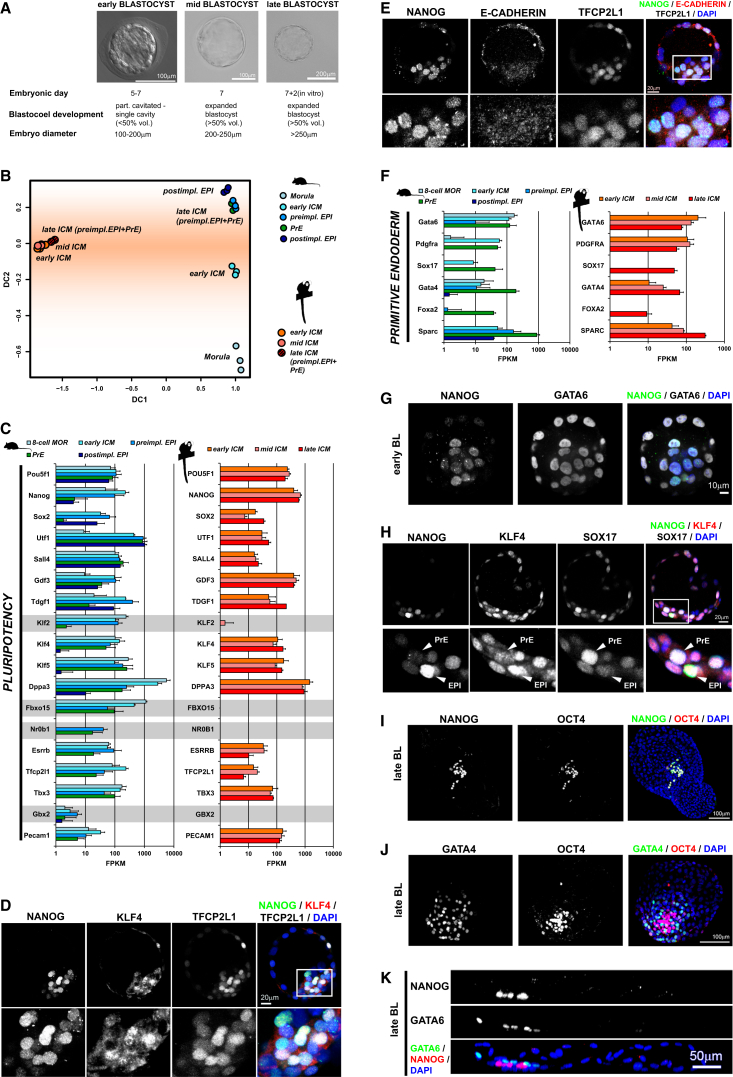
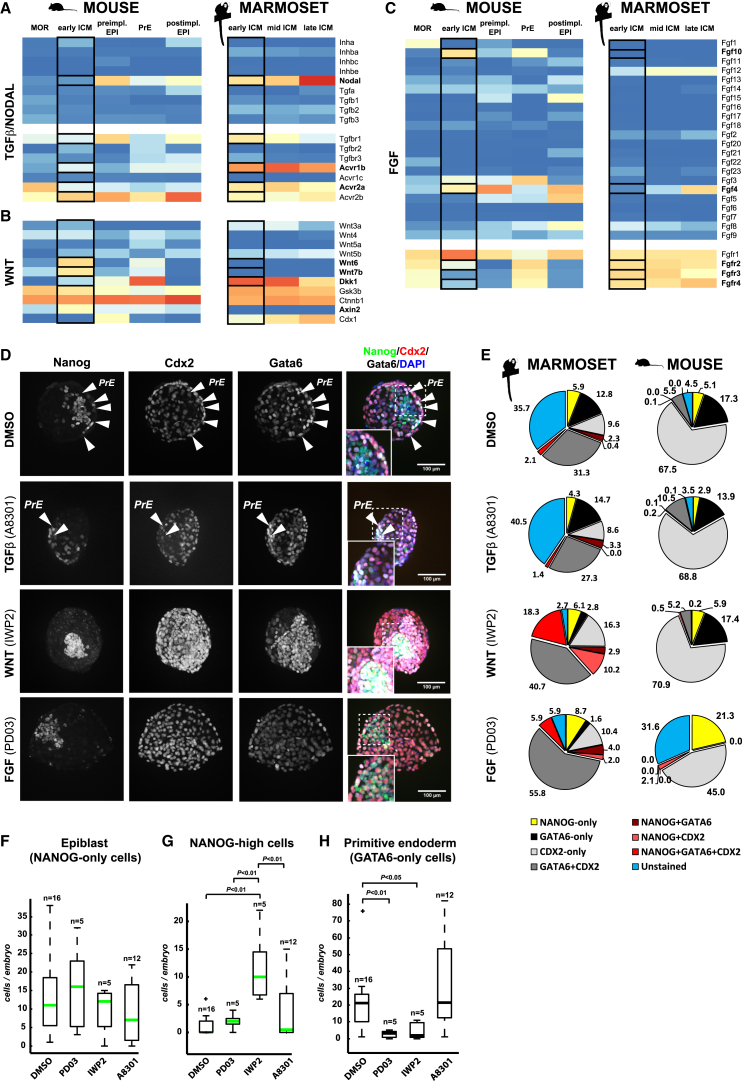
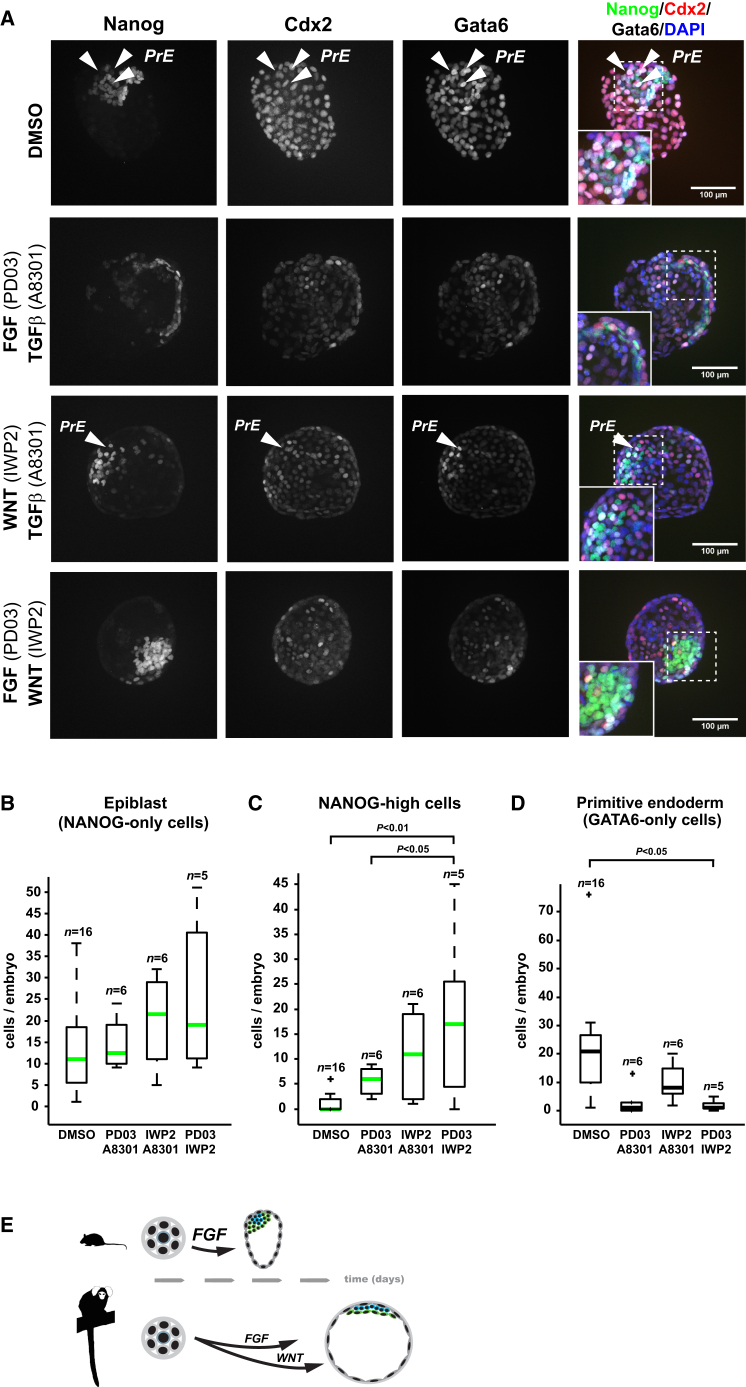
Naive pluripotency is manifest in the preimplantation mammalian embryo. Here we determine transcriptome dynamics of mouse development from the eight-cell stage to postimplantation using lineage-specific RNA sequencing. This method combines high sensitivity and reporter-based fate assignment to acquire the full spectrum of gene expression from discrete embryonic cell types. We define expression modules indicative of developmental state and temporal regulatory patterns marking the establishment and dissolution of naive pluripotency in vivo. Analysis of embryonic stem cells and diapaused embryos reveals near-complete conservation of the core transcriptional circuitry operative in the preimplantation epiblast. Comparison to inner cell masses of marmoset primate blastocysts identifies a similar complement of pluripotency factors but use of alternative signaling pathways. Embryo culture experiments further indicate that marmoset embryos utilize WNT signaling during early lineage segregation, unlike rodents. These findings support a conserved transcription factor foundation for naive pluripotency while revealing species-specific regulatory features of lineage segregation.

Keywords: diapause; embryonic stem cell; inner cell mass; pluripotency; primate.


Figures

Figure 1
Figure 1
Transcriptome Profiling of Mouse Embryonic Lineages (A) Overview of the developmental sequence analyzed. (B) Percentage of detected genes in RNA-seq data from single cells (white), small numbers of cells (blue), and conventional bulk RNA (black) on comparable cell types (Xue et al., 2013, Yan et al., 2013, Marks et al., 2012). (C) Distribution of nonzero expression values in log2 FPKM (fragments per kilobase of exon per million fragments mapped) for RNA-seq data from single cells (white), small numbers of cells (blue), and conventional bulk RNA (black). (D) Diffusion map of embryonic samples from morula to postimplantation epiblast; DC, diffusion coefficient. (E) Marker expression delineates the divergence of epiblast and PrE lineages. Genes specific to PrE and the preimplantation epiblast are marked in green and blue, respectively; shared genes are depicted in orange. Track width is scaled to relative expression normalized to the mean across all stages displayed.
Figure 2
Figure 2
Expression Modules Identified in Early Mouse Development and the Preimplantation-to-Postimplantation Epiblast Transition (A) Expression of dynamically expressed genes. Modules were derived by hierarchical clustering of scaled expression values. Selected transcription factors, signaling pathway components, and epigenetic regulators are shown with pluripotency-associated genes in bold. (B) PluriNet82 at the transition from pre- to postimplantation stages. Label and node sizes reflect interaction number. Colors represent expression in FPKM for preimplantation (E4.5; left) and postimplantation epiblasts (E5.5; right). Arrows indicate positive interactions; T bars indicate inhibitions. (C) Genes characteristic of preimplantation (green) and early postimplantation development (red). Track width is scaled to relative expression normalized to the mean across all stages displayed. (D) Epigenetic modifiers expressed predominantly at preimplantation (green) or early postimplantation (red) stages. (E) Simplified representation of the KEGG “tight junction” pathway, with nodes colored according to expression in the preimplantation (left) and postimplantation epiblast (right).
Figure 3
Figure 3
ESCs Retain Expression Modules Defining the Preimplantation Epiblast (A) Diffusion map from morula to postimplantation epiblast and ESC cultured in 2i/LIF, based on dynamically expressed genes. (B) Genes differentially expressed (p < 0.05) between ESCs and embryonic samples. (C) Most significantly enriched GO and KEGG pathways based on up- and downregulated genes in ESC versus preimplantation epiblast. (D) Changes in expression of PluriNet82 genes in the embryonic lineage. A node is displayed if the corresponding gene is predominantly active at that developmental stage, defined as positive log-transformed expression relative to the mean across all stages. An edge is displayed if both source and target nodes are active. (E) Minimal set of transcription factors operative in mouse ESCs (Dunn et al., 2014). Colors represent gene expression in FPKM. Expression levels are depicted for morula, early ICM, and pre- and postimplantation epiblasts clockwise from the top left.
Figure 4
Figure 4
Relationship between Diapaused Epiblast, Normal Embryonic Development, and ESC (A) Diffusion map of developmental stages from morula to postimplantation epiblast, ESC, and diapaused epiblast. (B) Expression scores for selected signaling pathways, scaled to the mean across the three cell types, calculated by summing FPKM values of individual components followed by normalization for pathway size. (C) Selected components of WNT and JAK/STAT signaling pathways for the samples indicated. (D) Ternary plot of the most divergent transcriptional and epigenetic regulators between preimplantation epiblast, ESC, and diapaused epiblast. FPKM values are scaled to the mean across the three cell types and are log transformed. (E) Differentially expressed genes in FPKM between preimplantation epiblast, diapaused epiblast, and ESC, as indicated. (F) Diffusion map based on dynamically expressed genes from morula to postimplantation epiblast, ESC, and diapaused epiblast.
Figure 5
Figure 5
Pluripotency Factors Are Conserved, whereas Signaling Receptors Diverge, in Mouse and Marmoset ICM (A) Staging criteria for isolation of early, mid, and late marmoset ICM and images of the blastocysts analyzed. (B) Diffusion map of mouse and marmoset embryonic samples. (C) Pluripotency gene expression for mouse and marmoset embryonic samples. Error bars represent SD. (D and E) Confocal z projections of whole-mount marmoset early-mid blastocyst immunofluorescence stainings for the markers indicated. (F) PrE-associated gene expression for mouse and marmoset embryonic samples. Error bars represent SD. (G–J) Immunofluorescence stainings of early, mid (H), and late marmoset blastocyst. (K) z-x cross-section of marmoset blastocyst stained for the markers indicated.
Figure 6
Figure 6
FGF and WNT Inhibition Disrupt Lineage Segregation in the Marmoset Blastocyst (A–C) Expression of selected components of the TGF-β/NODAL, FGF, and WNT signaling pathways. (D) Confocal z projections of inhibitor-treated marmoset late blastocysts stained for NANOG, CDX2, GATA6, and DAPI. (E) Fluorescence signal from cells labeled for lineage markers in mouse and marmoset embryos. Morulae were cultured under identical conditions to the late blastocyst stage in the presence of A8301 (3 μM), PD0325901 (3 μΜ), IWP2 (3 μΜ), or DMSO (control) for 3 and 4 days in mouse and marmoset, respectively. (F–H) Quantification of (F) NANOG-only, (G) NANOG-high, and (H) GATA6-only cells. Plotted are the first and second quartiles of data points (boxed) with error bars at minimum and maximum values. Outliers are indicated with a cross. NANOG-high cells displayed at least 1.5× average NANOG fluorescence intensity. p values were computed by one-way ANOVA with Tukey HSD (honest significant difference) testing.
Figure 7
Figure 7
Dual FGF and WNT Inhibition Increases NANOG Levels and Blocks PrE Formation (A) Confocal z projections of inhibitor-treated marmoset late blastocysts stained for NANOG, CDX2, GATA6, and DAPI. (B–D) Fluorescence quantification of (B) NANOG-only, (C) NANOG-high, and (D) GATA6-only cells. Outliers are indicated with a cross. NANOG-high cells displayed at least 1.5× average NANOG fluorescence intensity. p values were computed by one-way ANOVA with Tukey HSD testing. (E) Model of pathways driving lineage specification in mouse and marmoset ICM.

Comment in

References

    1. Adewumi O., Aflatoonian B., Ahrlund-Richter L., Amit M., Andrews P.W., Beighton G., Bello P.A., Benvenisty N., Berry L.S., Bevan S., International Stem Cell Initiative Characterization of human embryonic stem cell lines by the International Stem Cell Initiative. Nat. Biotechnol. 2007;25:803–816. - PubMed
    1. Anders S., Huber W. Differential expression analysis for sequence count data. Genome Biol. 2010;11:R106. - PMC - PubMed
    1. Arman E., Haffner-Krausz R., Chen Y., Heath J.K., Lonai P. Targeted disruption of fibroblast growth factor (FGF) receptor 2 suggests a role for FGF signaling in pregastrulation mammalian development. Proc. Natl. Acad. Sci. USA. 1998;95:5082–5087. - PMC - PubMed
    1. Artus J., Piliszek A., Hadjantonakis A.K. The primitive endoderm lineage of the mouse blastocyst: sequential transcription factor activation and regulation of differentiation by Sox17. Dev. Biol. 2011;350:393–404. - PMC - PubMed
    1. Bedzhov I., Zernicka-Goetz M. Self-organizing properties of mouse pluripotent cells initiate morphogenesis upon implantation. Cell. 2014;156:1032–1044. - PMC - PubMed

Publication types

MeSH terms