. 2015 Nov 9;28(5):653-665.
doi: 10.1016/j.ccell.2015.10.002.

Targeting the AAA ATPase p97 as an Approach to Treat Cancer through Disruption of Protein Homeostasis

Affiliations

Targeting the AAA ATPase p97 as an Approach to Treat Cancer through Disruption of Protein Homeostasis

Daniel J Anderson et al. Cancer Cell. .

Abstract

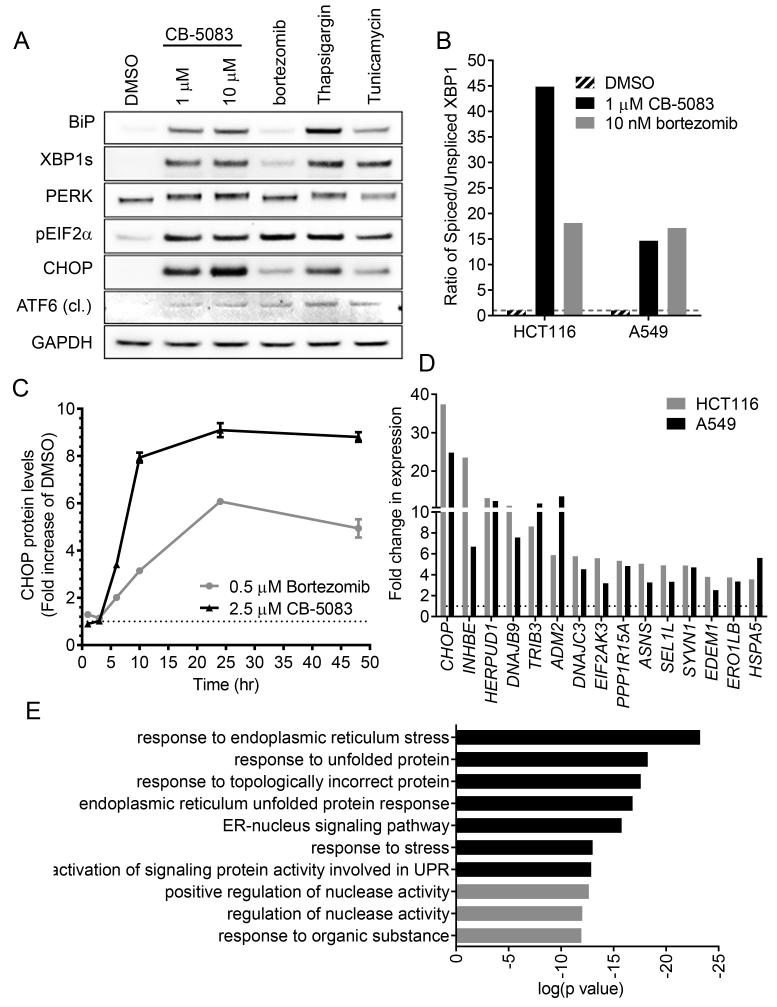
p97 is a AAA-ATPase with multiple cellular functions, one of which is critical regulation of protein homeostasis pathways. We describe the characterization of CB-5083, a potent, selective, and orally bioavailable inhibitor of p97. Treatment of tumor cells with CB-5083 leads to accumulation of poly-ubiquitinated proteins, retention of endoplasmic reticulum-associated degradation (ERAD) substrates, and generation of irresolvable proteotoxic stress, leading to activation of the apoptotic arm of the unfolded protein response. In xenograft models, CB-5083 causes modulation of key p97-related pathways, induces apoptosis, and has antitumor activity in a broad range of both hematological and solid tumor models. Molecular determinants of CB-5083 activity include expression of genes in the ERAD pathway, providing a potential strategy for patient selection.


Figures

Figure 1
Figure 1. CB-5083 is a potent inhibitor of p97’s D2 ATPase domain
(A) Chemical Structure of CB-5083 (B) Dose-response curve of CB-5083 with recombinant WT p97, p97E305Q and p97E578Q mutant proteins in an NADH coupled ATPase assay. The assay was conducted at 60 nM enzyme, 500 μM ATP and shown concentrations of CB-5083. R2 values were 0.98, 0.99 and 0.97 for WT, E305Q and E578Q respectively. (C) ATP competition assay of CB-5083 with WT p97 with increasing ATP concentration. (D) Crystal structure of p97-D2 showing ADP binding site and relative position of mutations found in resistant cells. (E) Comparison of IC50 values of shown compounds for p97 in biochemical assay utilizing NADH-based ATPase assay and cell viability assays utilizing ADP-glo. Error bars are +/− SEM. See also Figure S1 and Tables S1 and S2.
Figure 2
Figure 2. CB-5083 blocks major cellular protein degradation functions
(A) Example images of HEK293 cells expressing TCRα-GFP with RFP labeled endoplasmic reticulum (ER-RFP) treated with 2.5 μM CB-5083 or 1 μM bortezomib for 6 hr. Scale bar is 20 μm and applies to all panels. (B) Analysis of TCRα-GFP fluorescence in cells treated with dose titration of CB-5083 or bortezomib. R2 values were 0.95 and 0.93 for bortezomib and CB-5083 respectively. (C) Example images of NSCLC lung cancer cell line A549 labeled with anti-K48 ubiquitin (K48-Ub) and anti-p62 antibodies treated with 2.5 μM CB-5083 or 1 μM bortezomib for 6 hr. Scale bar is 20 μm and applies to all panels. (D) K48-Uband p62 were evaluated by immunofluorescence in A549 cells treated with dose titration of CB-5083 or bortezomib. R2 values were 0.91 and 0.94 for bortezomib and CB-5083 respectively. (E) Colon cancer cell line HCT116 was treated with CB-5083 or bortezomib for 24 hr. K48-Ubiquitin conjugates and p53 were analyzed by western blot. (F) p62 modulation was evaluated by immunofluorescence in A549 cells treated with CB-5083, bortezomib, NMS-873, INK128 and Bafilomycin A1. R2 values were and 0.96, 0.93, 0.83, 0.78 and 0.86 for CB-5083, NMS-873, bafilomycin A1, INK128 and bortezomib respectively. Error bars are +/− SEM. See also Figures S2.
Figure 3
Figure 3. CB-5083 induces a strong unfolded protein response
(A) A549 cells were treated with CB-5083, bortezomib (1 μM), thapsigargin (1 μM) or tunicamycin (2 μg/ml) for 8 hr. Western blot analysis was performed with antibodies against BiP, spliced XBP1 (XBP1s), PERK, phospho-EIF2a, CHOP, cleaved (cl) ATF6 and GAPDH. (B) A549 cells were treated with CB-5083 (2.5 μM) or bortezomib (0.5 μM) for the indicated times and CHOP protein levels were quantified by immunofluorescence staining. (C) A549 or HCT116 cells were treated with CB-5083 (1 μM) for 8 hr. Relative gene expression of a panel of UPR genes, spliced XBP1 and unspliced XBP1 were measured by RT-PCR. (D) A549 or HCT116 cells were treated with CB-5083 (1 μM) or bortezomib (10 nM) for 8 hr. Relative gene expression of spliced and unspliced XBP1 were measured by RT-PCR. (E) HCT116 cells were treated with CB-5083 (1 μM) for 8 hr and processed for RNA-seq. Gene ontology (GO) enrichment analysis was performed on top 500 upregulated genes. Top ten most significant GO terms are listed. Error bars are +/− SEM. See also Figure S3 and Table S3.
Figure 4
Figure 4. Induction of UPR by CB-5083 causes cancer cell death
(A) A549 cells were treated with CB-5083 (1 μM) for the indicated times. Relative DR5 gene expression was measured by RT-PCR. (B-D) A549 or HCT116 cells were treated with CB-5083 (5 μM) for up to 72 hr. Caspase-8 activity (B), caspase-3/7 activity (C) or cell count (D) were measured at indicated times. (E) BiP, PERK, CHOP, DR5 and caspase-8 were knocked down in HCT116 cells for 24 hr. Cells were then treated with CB-5083 (2.5 μM) for 24 hr and cell viability was measured by cell titer glo. Error bars are +/− SEM. See also Figure S4.
Figure 5
Figure 5. CB-5083 has activity in mouse models
(A) Tumor (open box) and plasma (open circle) concentrations of CB-5083 in tumor tissue extracts from nude mice bearing HCT116 tumors after treatment at 25 mg/kg and 100 mg/kg. (B-E) Levels of poly-ubiquitin (B), CHOP (C), p62 (D), and cleaved PARP (E) were measured in tumor tissue extracts from nude mice bearing HCT116 tumors after treatment at 25 mg/kg and 100 mg/kg of CB-5083. (F) Tumor growth was measured for various CB-5083 dosing schedules in the HCT116 xenograft model (n=7-10). (G) Tumor growth was measured with dosing of CB-5083 in NCI-H1838 (n=16), AMO-1 (n=12), CTG-0360 (n=4), CTG-0081 (n=4) xenograft models. Error bars are +/− SEM. See also Figure S5.
Figure 6
Figure 6. CB-5083 demonstrates greater activity than proteasome inhibitors in solid tumor models
(A) Relative levels of poly-ubiquitin measured in HCT116 or A549 xenografts in mice administered CB-5083 or proteasome inhibitors (n=3 per time point). (B) Relative levels of CHOP measured in HCT116 xenografts in (A). (C) Tumor growth was measured with dosing of CB-5083 or proteasome inhibitors in HCT116 (n=8-12) and A549 (n=10-12) xenograft models. Error bars are +/− SEM. See also Figure S6.
Figure 7
Figure 7. Activation of MAPK pathway correlates with sensitivity to CB-5083 in cancer cells
(A) 340 cancer cell lines were treated with a dose titration of CB-5083, EC50 of cell viability was measured at 72 hr. Cell lines are ordered by EC50. (B) Tumor growth inhibition (TGI) of a panel of cell lines in subcutaneous xenografts after oral administration of 100 mg/kg CB-5083 on a qd 4 days on 3 days off schedule for 3-4 weeks was compared to EC50 of the same cell lines grown in culture in a 72 hr viability assay. (C) p97 gene copy number as measured by hybrid capture was plotted against CB-5083 EC50 of viability in a panel of cancer cell lines. Statistical significance of fit to linear regression is calculated with an F test (p value). (D) p97 mRNA level as measured by microarray was plotted against CB-5083 EC50 of viability in a panel of cancer cell lines. Statistical significance of fit to linear regression is calculated with an F test (p value). (E) Viability in A549 cells stably expressing inducible control shRNA or shRNA targeting p97 after 3 days of 500 μM IPTG treatment to induce the expression of shRNAs followed by 3 days of CB-5083 treatment. EC50 values were compared to p97 protein levels as measured by Western blot. (F) CB-5083 EC50 of viability in cell lines containing an oncogenic mutation in KRAS, NRAS, HRAS, BRAF, or NF1 were compared to cells that were wild-type for all of these genes. (G) CB-5083 EC50 of viability in cell lines with high or low levels of phosphorylated ERK1 and ERK2 were compared. (H) TGI for a set of cell lines grown as xenografts was plotted against the ratio of phosphorylated ERK1+ ERK2 to total ERK1+ ERK2 as measured by Western blot. See also Figure S7.

Comment in

References

    1. Barretina J, Caponigro G, Stransky N, Venkatesan K, Margolin AA, Kim S, Wilson CJ, Lehar J, Kryukov GV, Sonkin D, et al. The Cancer Cell Line Encyclopedia enables predictive modelling of anticancer drug sensitivity. Nature. 2012;483:603–607. - PMC - PubMed
    1. Bence NF, Sampat RM, Kopito RR. Impairment of the ubiquitin-proteasome system by protein aggregation. Science. 2001;292:1552–1555. - PubMed
    1. Benjamini Y, Yekutieli D. The control of the false discovery rate in multiple testing under dependency. 2001:1165–1188.
    1. Bjorkoy G, Lamark T, Johansen T. p62/SQSTM1: a missing link between protein aggregates and the autophagy machinery. Autophagy. 2006;2:138–139. - PubMed
    1. Bucheit AD, Davies MA. Emerging insights into resistance to BRAF inhibitors in melanoma. Biochemical pharmacology. 2014;87:381–389. - PubMed

Publication types

MeSH terms

Associated data