

Continuous Distributed Representation of Biological Sequences for Deep Proteomics and Genomics
- PMID: 26555596
- PMCID: PMC4640716
- DOI: 10.1371/journal.pone.0141287
Continuous Distributed Representation of Biological Sequences for Deep Proteomics and Genomics
Abstract
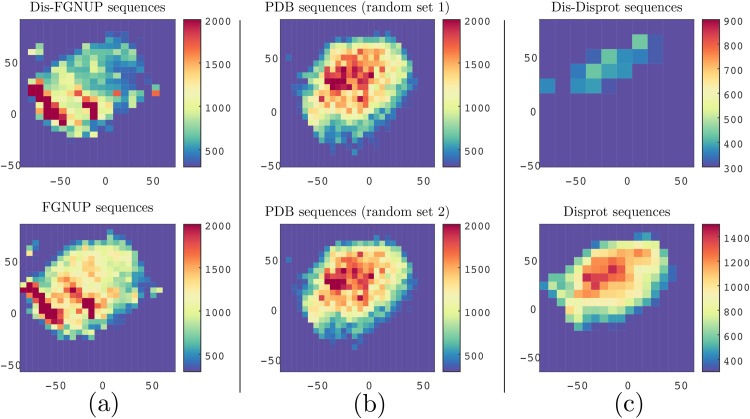
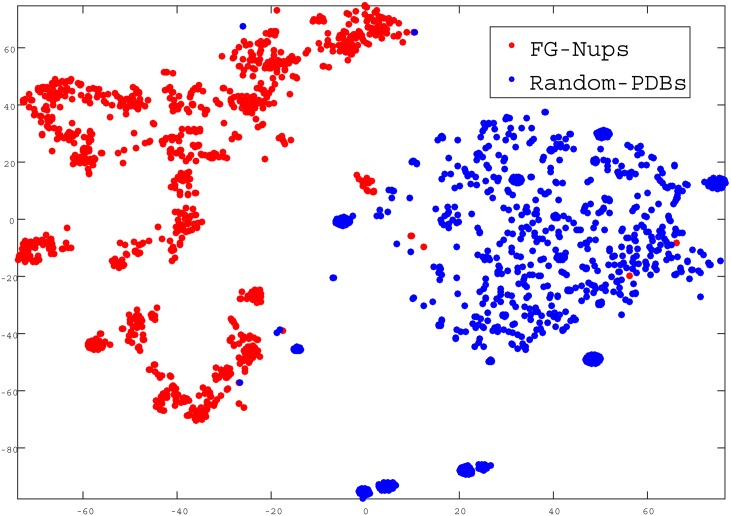
We introduce a new representation and feature extraction method for biological sequences. Named bio-vectors (BioVec) to refer to biological sequences in general with protein-vectors (ProtVec) for proteins (amino-acid sequences) and gene-vectors (GeneVec) for gene sequences, this representation can be widely used in applications of deep learning in proteomics and genomics. In the present paper, we focus on protein-vectors that can be utilized in a wide array of bioinformatics investigations such as family classification, protein visualization, structure prediction, disordered protein identification, and protein-protein interaction prediction. In this method, we adopt artificial neural network approaches and represent a protein sequence with a single dense n-dimensional vector. To evaluate this method, we apply it in classification of 324,018 protein sequences obtained from Swiss-Prot belonging to 7,027 protein families, where an average family classification accuracy of 93%±0.06% is obtained, outperforming existing family classification methods. In addition, we use ProtVec representation to predict disordered proteins from structured proteins. Two databases of disordered sequences are used: the DisProt database as well as a database featuring the disordered regions of nucleoporins rich with phenylalanine-glycine repeats (FG-Nups). Using support vector machine classifiers, FG-Nup sequences are distinguished from structured protein sequences found in Protein Data Bank (PDB) with a 99.8% accuracy, and unstructured DisProt sequences are differentiated from structured DisProt sequences with 100.0% accuracy. These results indicate that by only providing sequence data for various proteins into this model, accurate information about protein structure can be determined. Importantly, this model needs to be trained only once and can then be applied to extract a comprehensive set of information regarding proteins of interest. Moreover, this representation can be considered as pre-training for various applications of deep learning in bioinformatics. The related data is available at Life Language Processing Website: http://llp.berkeley.edu and Harvard Dataverse: http://dx.doi.org/10.7910/DVN/JMFHTN.
Conflict of interest statement
Figures
References
Publication types
MeSH terms
Substances
LinkOut - more resources
Full Text Sources
Other Literature Sources
