. 2016 Feb;33(2):498-509.
doi: 10.1007/s11095-015-1805-0. Epub 2015 Nov 10.

Model-Based Optimisation of Deferoxamine Chelation Therapy

Affiliations

Model-Based Optimisation of Deferoxamine Chelation Therapy

Francesco Bellanti et al. Pharm Res. 2016 Feb.

Abstract

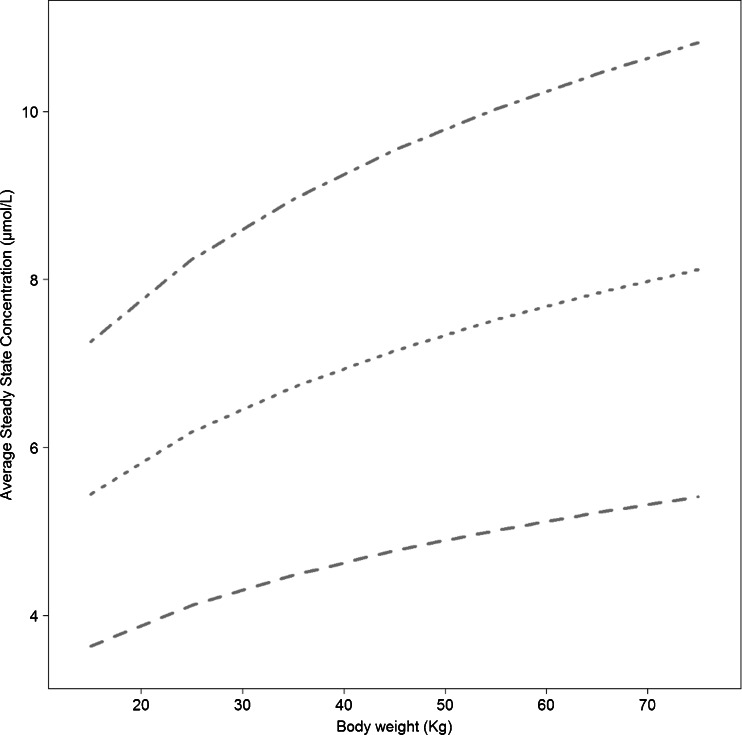
Purpose: Here we show how a model-based approach may be used to provide further insight into the role of clinical and demographic covariates on the progression of iron overload. The therapeutic effect of deferoxamine is used to illustrate the application of disease modelling as a means to characterising treatment response in individual patients.

Methods: Serum ferritin, demographic characteristics and individual treatment data from clinical routine practice on 27 patients affected by β-thalassaemia major were used for the purposes of this analysis. The time course of serum ferritin was described by a hierarchical nonlinear mixed effects model, in which compliance was parameterised as a covariate factor. Modelling and simulation procedures were implemented in NONMEM (7.2.0).

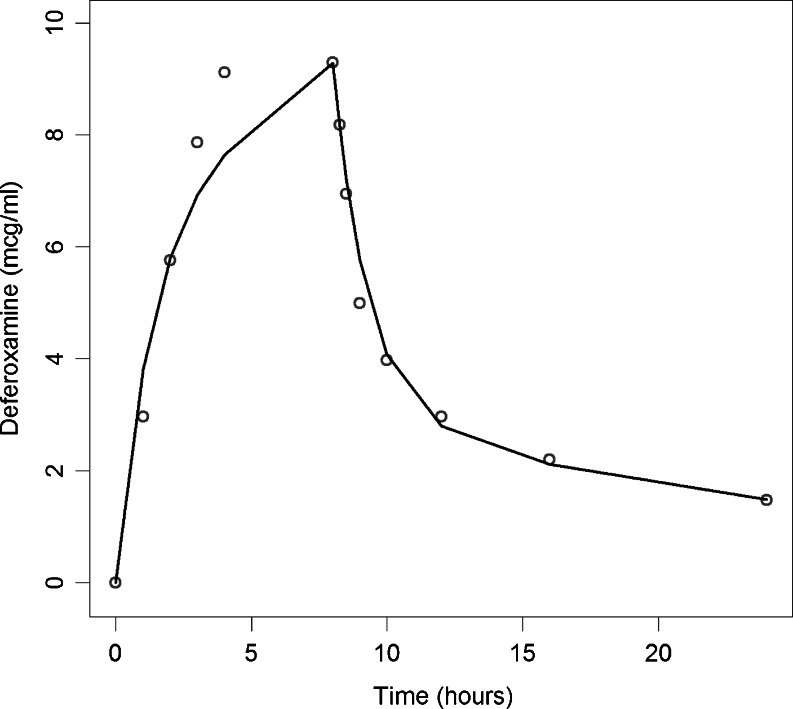
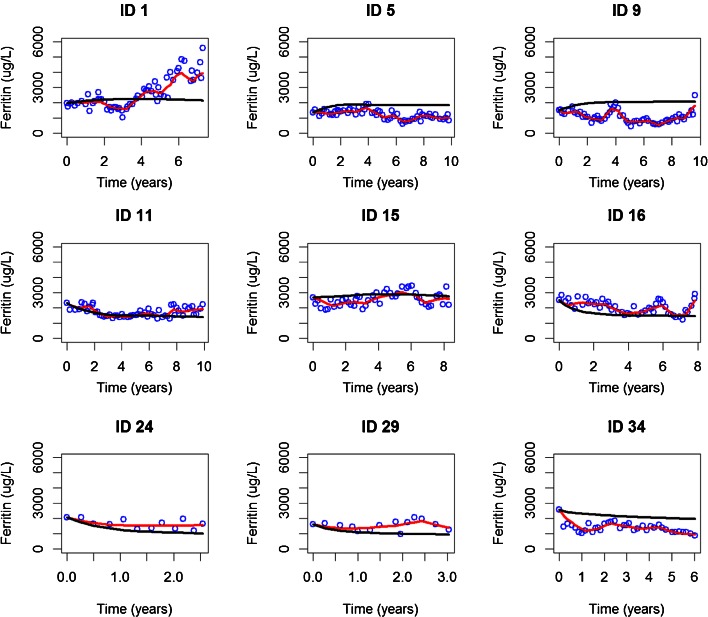
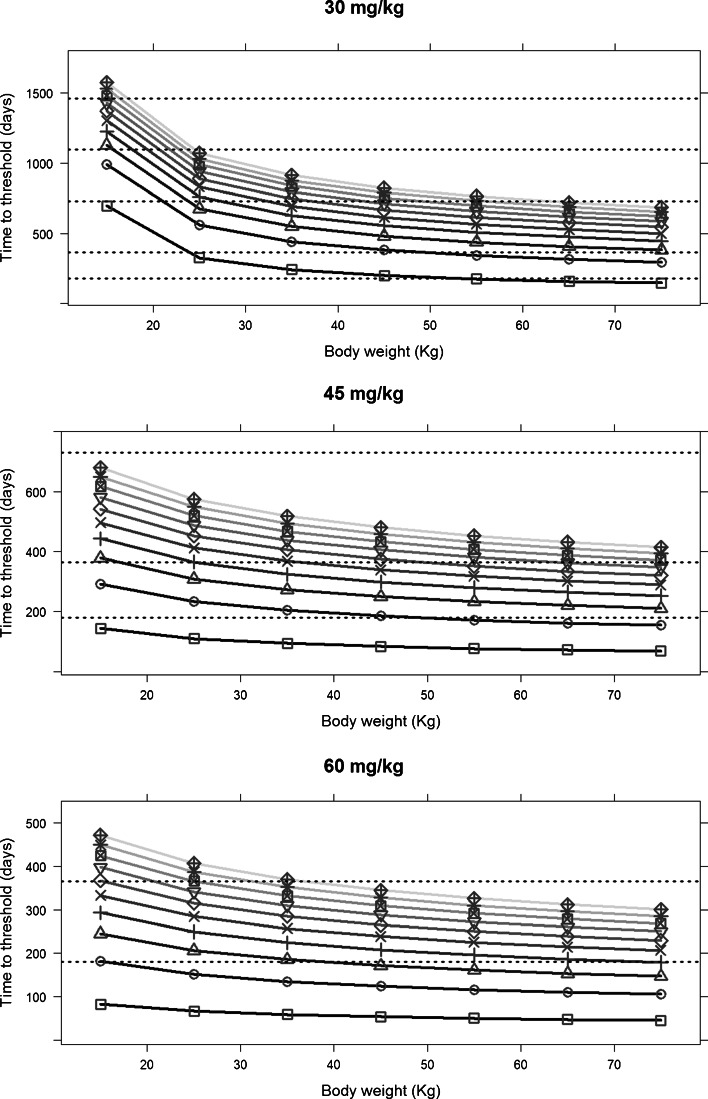
Results: A turnover model best described serum ferritin changes over time, with the effect of blood transfusions introduced on the ferritin conversion rate and the effect of deferoxamine on the elimination parameter (Kout) in a proportional manner. The results of the simulations showed that poor quality of execution is preferable over drug holidays; and that independently of the compliance pattern, the therapeutic intervention is not effective if >60% of the doses are missed.

Conclusions: Modelling of ferritin response enables characterisation of the dynamics of iron overload due to chronic transfusion. The approach can be used to support decision making in clinical practice, including personalisation of the dose for existing and novel chelating agents.

Keywords: PKPD modelling; adherence; deferoxamine; disease modelling; dose rationale; iron overload.


Figures

Fig. 1
Fig. 1
Predicted and observed pharmacokinetic profile of deferoxamine. The circles represent the mean deferoxamine concentrations reported in literature (25). The solid line represents the population model prediction.
Fig. 2
Fig. 2
Individual plots of 9 randomly selected patients: observed data are shown as blue circles; the black and red solid lines represent, respectively, the population (Pred) and individual predictions (IPred).
Fig. 3
Fig. 3
Average steady state concentration by body weight for 7 typical individuals receiving three different deferoxamine doses: 30 (- - -), 45 (....) and 60 (-.-.-) mg/kg/day.
Fig. 4
Fig. 4
Visual predictive check: observed data are depicted by grey circles; the red and blue solid line represent, respectively, the median and the 5th and 95th percentiles of the observed data. The red and blue shaded area represent, respectively, the 95th CI of the median and the 95th CI of the 5th and 95th percentiles of the simulated data.
Fig. 5
Fig. 5
Time to reach a serum ferritin threshold of 2500 ug/L for varying exposure levels in patients with different body weights (15 to 75 kg). The panels show three scenarios where 30, 45 and 60 mg/kg dosing regimen were evaluated. Each line represents a different starting baseline ferritin level (darker to lighter shows an increase in the starting baseline levels). Square, circle, triangle with point up, plus, cross, diamond, triangle with point down, square cross, star and diamond plus represent starting baseline ferritin values, respectively of 3000, 4000, 5000, 6000, 7000, 8000, 9000, 10,000, 11,000 and 12,000 ug/L. The dashed horizontal lines represent indicative thresholds at 6 months, 1, 2, 3, 4 and 5 years.
Fig. 6
Fig. 6
Time to reach a serum ferritin threshold of 2500 mcg/L for different compliance scenarios (10 to 90% of missed doses). The panels show five scenarios where different compliance patterns have been evaluated (see Table II). Each line represents a different starting baseline ferritin level (darker to lighter shows an increase in the starting baseline levels). Square, circle, triangle with point up, plus, cross, diamond, triangle with point down, square cross, star and diamond plus represent a starting baseline ferritin level, respectively of 3000, 4000, 5000, 6000, 7000, 8000, 9000, 10,000, 11,000 and 12,000 ug/L. The dashed horizontal lines represent indicative thresholds at 6 months, 1, 2, 3, 4 and 5 years.

References

    1. Gibbons R, Higgs DR, Old JM, Olivieri NF, Swee Lay T, Wood WG. The thalassaemia syndromes. 4th edn. Blackwell Sci; 2001.
    1. Galanello R, Origa R. Beta-thalassemia. Orphanet J Rare Dis. 2010;5:11. doi: 10.1186/1750-1172-5-11. - DOI - PMC - PubMed
    1. Ginzburg Y, Rivella S. Β-thalassemia: a model for elucidating the dynamic regulation of ineffective erythropoiesis and iron metabolism. Blood. 2011;118(16):4321–30. doi: 10.1182/blood-2011-03-283614. - DOI - PMC - PubMed
    1. Rebulla P. Blood transfusion in beta thalassaemia major. Transfus Med. 1995;5(4):247–58. doi: 10.1111/j.1365-3148.1995.tb00210.x. - DOI - PubMed
    1. Rebulla P, Modell B. Transfusion requirements and effects in patients with thalassaemia major. Lancet. 1991;337:277–80. doi: 10.1016/0140-6736(91)90881-O. - DOI - PubMed

Publication types

MeSH terms

LinkOut - more resources