

Type 1 Diabetes Prevention in NOD Mice by Targeting DPPIV/CD26 Is Associated with Changes in CD8⁺T Effector Memory Subset
- PMID: 26555789
- PMCID: PMC4640511
- DOI: 10.1371/journal.pone.0142186
Type 1 Diabetes Prevention in NOD Mice by Targeting DPPIV/CD26 Is Associated with Changes in CD8⁺T Effector Memory Subset
Abstract
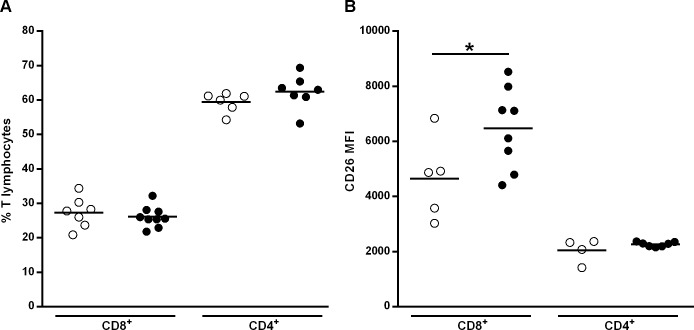
CD26 is a T cell activation marker consisting in a type II transmembrane glycoprotein with dipeptidyl peptidase IV (DPPIV) activity in its extracellular domain. It has been described that DPPIV inhibition delays the onset of type 1 diabetes and reverses the disease in non-obese diabetic (NOD) mice. The aim of the present study was to assess the effect of MK626, a DPPIV inhibitor, in type 1 diabetes incidence and in T lymphocyte subsets at central and peripheral compartments. Pre-diabetic NOD mice were treated with MK626. Diabetes incidence, insulitis score, and phenotyping of T lymphocytes in the thymus, spleen and pancreatic lymph nodes were determined after 4 and 6 weeks of treatment, as well as alterations in the expression of genes encoding β-cell autoantigens in the islets. The effect of MK626 was also assessed in two in vitro assays to determine proliferative and immunosuppressive effects. Results show that MK626 treatment reduces type 1 diabetes incidence and after 6 weeks of treatment reduces insulitis. No differences were observed in the percentage of T lymphocyte subsets from central and peripheral compartments between treated and control mice. MK626 increased the expression of CD26 in CD8+ T effector memory (TEM) from spleen and pancreatic lymph nodes and in CD8+ T cells from islet infiltration. CD8+TEM cells showed an increased proliferation rate and cytokine secretion in the presence of MK626. Moreover, the combination of CD8+ TEM cells and MK626 induces an immunosuppressive response. In conclusion, treatment with the DPPIV inhibitor MK626 prevents experimental type 1 diabetes in association to increase expression of CD26 in the CD8+ TEM lymphocyte subset. In vitro assays suggest an immunoregulatory role of CD8+ TEM cells that may be involved in the protection against autoimmunity to β pancreatic islets associated to DPPIV inhibitor treatment.
Conflict of interest statement
Figures


Similar articles
-
CD26/DPPIV inhibition alters the expression of immune response-related genes in the thymi of NOD mice.Mol Cell Endocrinol. 2016 May 5;426:101-12. doi: 10.1016/j.mce.2016.02.014. Epub 2016 Feb 18. Mol Cell Endocrinol. 2016. PMID: 26911933
-
The effects of DPP-IV inhibition in NOD mice with overt diabetes.Folia Biol (Praha). 2013;59(3):116-22. Folia Biol (Praha). 2013. PMID: 23890479
-
Combining MK626, a novel DPP-4 inhibitor, and low-dose monoclonal CD3 antibody for stable remission of new-onset diabetes in mice.PLoS One. 2014 Sep 30;9(9):e107935. doi: 10.1371/journal.pone.0107935. eCollection 2014. PLoS One. 2014. PMID: 25268801 Free PMC article.
-
Kinetic evolution of a diabetogenic CD8+ T cell response.Ann N Y Acad Sci. 2003 Nov;1005:88-97. doi: 10.1196/annals.1288.010. Ann N Y Acad Sci. 2003. PMID: 14679043 Review.
-
Dipeptidyl peptidase in autoimmune pathophysiology.Adv Clin Chem. 2011;53:51-84. doi: 10.1016/b978-0-12-385855-9.00003-5. Adv Clin Chem. 2011. PMID: 21404914 Review.
Cited by
-
Dipeptidyl peptidase-4(DPP-4) inhibitors: promising new agents for autoimmune diabetes.Clin Exp Med. 2018 Nov;18(4):473-480. doi: 10.1007/s10238-018-0519-0. Epub 2018 Jul 17. Clin Exp Med. 2018. PMID: 30022375 Review.
-
DPP-4 Inhibition Leads to Decreased Pancreatic Inflammatory Profile and Increased Frequency of Regulatory T Cells in Experimental Type 1 Diabetes.Inflammation. 2019 Apr;42(2):449-462. doi: 10.1007/s10753-018-00954-3. Inflammation. 2019. PMID: 30707388
-
Possible Long-Term Efficacy of Sitagliptin, a Dipeptidyl Peptidase-4 Inhibitor, for Slowly Progressive Type 1 Diabetes (SPIDDM) in the Stage of Non-Insulin-Dependency: An Open-Label Randomized Controlled Pilot Trial (SPAN-S).Diabetes Ther. 2017 Oct;8(5):1123-1134. doi: 10.1007/s13300-017-0299-7. Epub 2017 Sep 19. Diabetes Ther. 2017. PMID: 28929327 Free PMC article.
References
-
- Atkinson MA, Maclaren NK. The pathogenesis of insulin-dependent diabetes mellitus. N Engl J Med. 1994;331: 1428–1436. - PubMed
-
- Atkinson MA, Leiter EH. The NOD mouse model of type 1 diabetes: as good as it gets?. Nat Med. 1999;5: 601–604. - PubMed
-
- Tanaka T, Camerini D, Seed B, Torimoto Y, Dang NH, Kameoka J, et al. Cloning and functional expression of the T cell activation antigen CD26. J Immunol. 1992; 149: 481–6. - PubMed
-
- Boonacker E, Van Noorden CJ. The multifunctional or moonlighting protein CD26/DPPIV. Eur J Cell Biol. 2003;82: 53–73. - PubMed
Publication types
MeSH terms
Substances
LinkOut - more resources
Full Text Sources
Other Literature Sources
Medical
Research Materials
Miscellaneous
