. 2015 Nov 10;6(6):e01282-15.
doi: 10.1128/mBio.01282-15.

Symbiotic Human Gut Bacteria with Variable Metabolic Priorities for Host Mucosal Glycans

Affiliations

Symbiotic Human Gut Bacteria with Variable Metabolic Priorities for Host Mucosal Glycans

Nicholas A Pudlo et al. mBio. .

Abstract

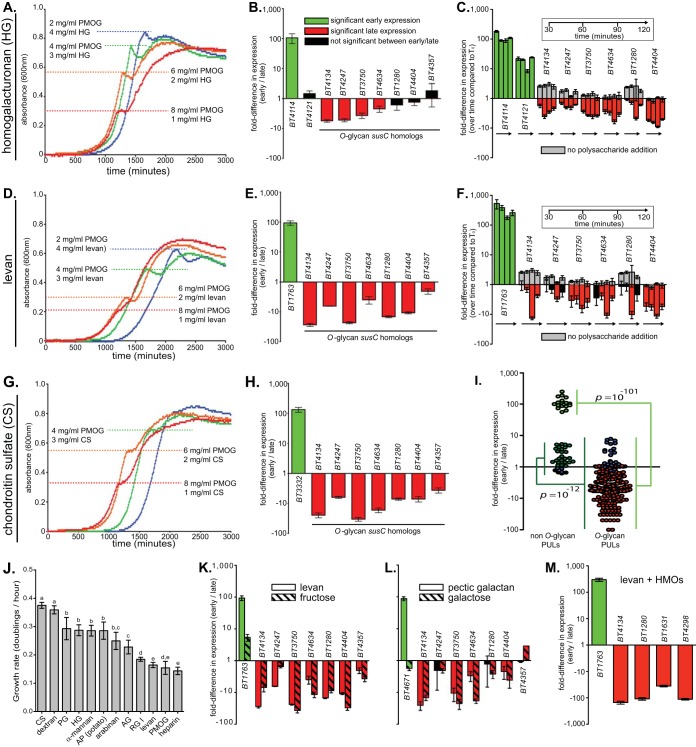
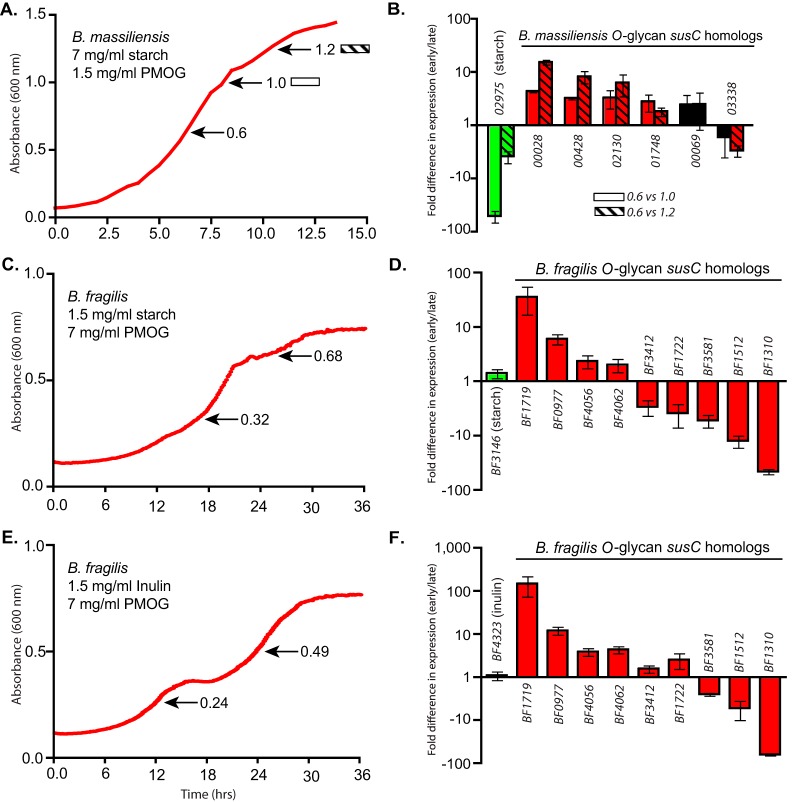
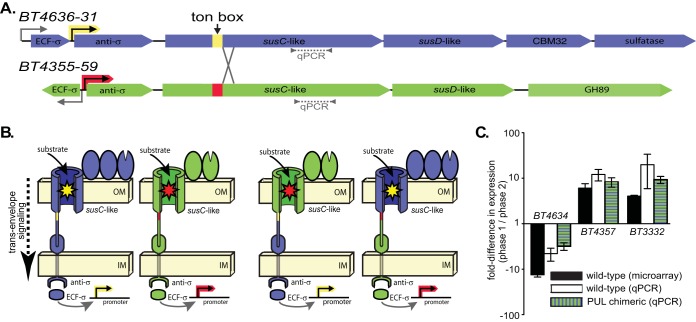
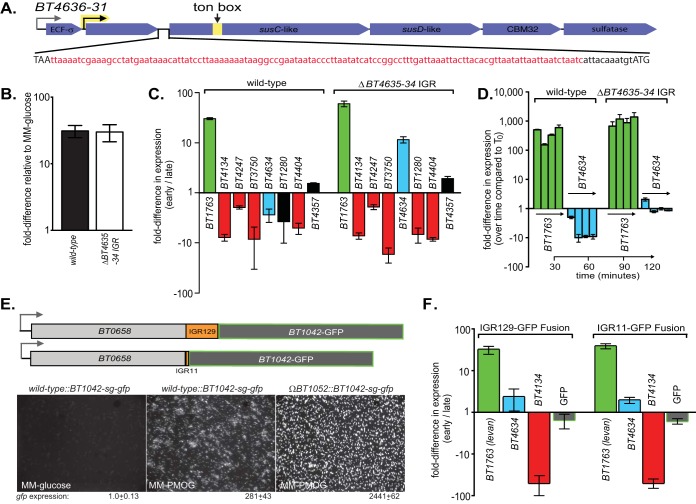
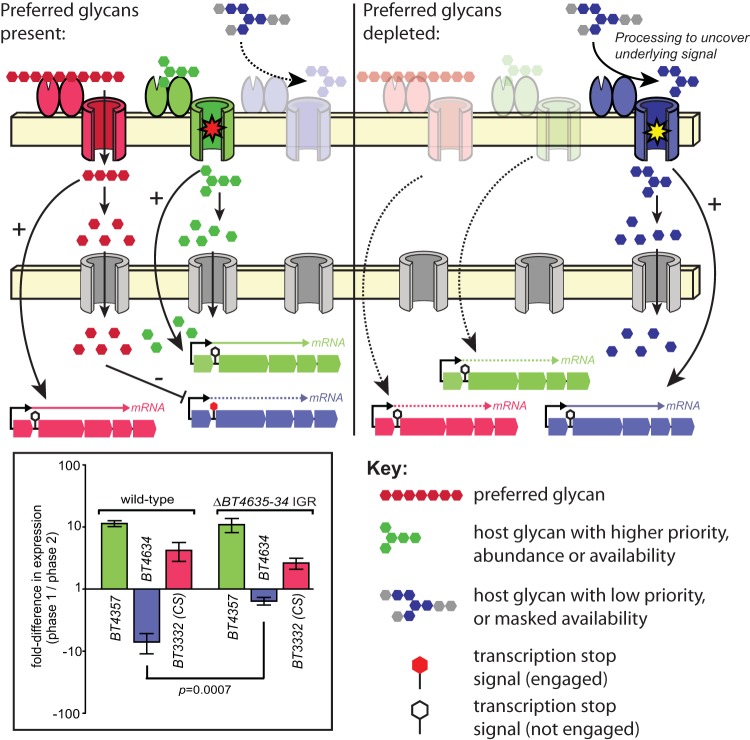
Many symbiotic gut bacteria possess the ability to degrade multiple polysaccharides, thereby providing nutritional advantages to their hosts. Like microorganisms adapted to other complex nutrient environments, gut symbionts give different metabolic priorities to substrates present in mixtures. We investigated the responses of Bacteroides thetaiotaomicron, a common human intestinal bacterium that metabolizes more than a dozen different polysaccharides, including the O-linked glycans that are abundant in secreted mucin. Experiments in which mucin glycans were presented simultaneously with other carbohydrates show that degradation of these host carbohydrates is consistently repressed in the presence of alternative substrates, even by B. thetaiotaomicron previously acclimated to growth in pure mucin glycans. Experiments with media containing systematically varied carbohydrate cues and genetic mutants reveal that transcriptional repression of genes involved in mucin glycan metabolism is imposed by simple sugars and, in one example that was tested, is mediated through a small intergenic region in a transcript-autonomous fashion. Repression of mucin glycan-responsive gene clusters in two other human gut bacteria, Bacteroides massiliensis and Bacteroides fragilis, exhibited variable and sometimes reciprocal responses compared to those of B. thetaiotaomicron, revealing that these symbionts vary in their preference for mucin glycans and that these differences occur at the level of controlling individual gene clusters. Our results reveal that sensing and metabolic triaging of glycans are complex processes that vary among species, underscoring the idea that these phenomena are likely to be hidden drivers of microbiota community dynamics and may dictate which microorganisms preferentially commit to various niches in a constantly changing nutritional environment.

Importance: Human intestinal microorganisms impact many aspects of health and disease, including digestion and the propensity to develop disorders such as inflammation and colon cancer. Complex carbohydrates are a major component of the intestinal habitat, and numerous species have evolved and refined strategies to compete for these coveted nutrients. Our findings reveal that individual bacteria exhibit different preferences for carbohydrates emanating from host diet and mucosal secretions and that some of these prioritization strategies are opposite to one another. Thus, we reveal new aspects of how individual bacteria, some with otherwise similar metabolic potential, partition to "preferred niches" in the complex gut ecosystem, which has important and immediate implications for understanding and predicting the behavioral dynamics of this community.


Figures

FIG 1
FIG 1
B. thetaiotaomicron deprioritizes O-glycan metabolism in the presence of competing glycans and monosaccharides. (A) B. thetaiotaomicron growth curves in mixtures of homogalacturonan (HG) and PMOG. The dashed horizontal lines indicate the pause in exponential growth that occurs as a function of changing glycan mix concentrations. (B) Relative expression differences between early and late growth phases for B. thetaiotaomicron grown in a mixture of HG and PMOG (1.5 mg/ml and 7 mg/ml, respectively). Early and late samples were harvested before and after the pause, respectively. A total of seven previously identified O-glycan-responsive PULs (6) were monitored for changes in expression based on the criteria that they were induced more than 8.5-fold in pure PMOG and are not part of recombinational shufflons that might obfuscate temporal expression. PULs with statistically significant (P ≤ 0.05 by one-tailed Student’s t test) increases in expression during early growth, PULs with statistically significant increases in later growth, and PULs with no significant changes in early versus late growth are shown. (C) A “spike-in” experiment in which B. thetaiotaomicron was grown to mid-exponential phase on 10 mg/ml PMOG alone and then HG (final concentration of 2.5 mg/ml) was abruptly introduced. Bacterial samples were harvested at 30-, 60-, 90-, and 120-min intervals after the introduction of HG. A corresponding negative control (minimal medium with no carbon) was used to monitor changes in O-glycan PUL expression (gray bars). Expression changes were determined relative to the culture grown in PMOG only (time zero [T0]). (D to H) Experiments similar to those described above, but with levan or chondroitin sulfate (CS) as the competing glycan. Additional experiments for pairwise combinations are shown in Fig. S1 in the supplemental material. (I) Aggregate expression differences of all PULs involved in metabolizing O-glycans and the non-O-glycans tested. Each symbol shows the value for one separate biological replicate of three conducted for each combination. (J) Exponential growth rates of B. thetaiotaomicron on all individual glycans tested. PG, pectic galactan; AP, amylopectin; AG, arabinogalactan; RG I, rhamnogalacturonan I. (Letters over each bar indicate data groupings in which the t test P values were <0.001). (K and L) Additional early/late growth phase experiments comparing the responses to a competing polysaccharide (levan and pectic galactan) and their corresponding monosaccharides (fructose and galactose). (M) HMO-responsive PUL (11) expression during early and late growth in a mixture of levan and human milk oligosaccharides (HMOs). A total of three biological replicates were conducted for each experimental condition, including bacterial growth curves. All values are means ± standard deviations (SD) (error bars), except in panels C and F, where they are means ± standard errors (SE) (error bars).
FIG 2
FIG 2
(A) Bmassiliensis growth curve in a potato amylopectin (starch)/PMOG mix. (B) Relative expression of Bmassiliensis O-glycan-responsive PULs between early and late growth. Two later growth point transcripts were analyzed (absorbance at 600 nm values of 1.0 and 1.2) and compared separately back to the early growth point (A600 = 0.6). (C) B. fragilis growth curve in a potato amylopectin (starch)/PMOG mix. (D) Relative expression of B. fragilis O-glycan-responsive PULs between early and late growth in an APpot (potato amylopectin) (starch)/PMOG mix. (E) B. fragilis growth curve in an inulin/PMOG mix. (F) Relative expression of B. fragilis O-glycan-responsive PULs between early and late growth in an inulin/PMOG mix. Note the reciprocal amounts of starch and PMOG required for B. massiliensis analysis compared to similar experiments with B. thetaiotaomicron. All expression values are significant (P ≤ 0.05 by one-tailed Student’s t test), except for those values labeled in black. All values are mean ± SD.
FIG 3
FIG 3
(A) A schematic of the O-glycan-responsive PULs, BT4636-31 and BT4355-59, showing the presumed locations, based on previous microarray data (6), of noninducible promoters (bent arrows), ECF-σ-inducible promoters (colored bent arrows), predicted Ton boxes, and chimeric recombination sites. (B) Cellular organization of chimeric Sus-like systems encoded by the above PULs separating glycan sensing at outer membrane TonB-dependent transporters (yellow and red stars) and genetic regulation via inducible promoters and genes encoding ECF-σ and anti-σ factors. See Fig. S6E in the supplemental material for a detailed illustration of the genetic recombination scheme used. OM, outer membrane; IM, inner membrane. (C) Growth phase-specific expression of BT4634 and BT4357 in an undefined mixture containing O-glycans and glycosaminoglycans (GAGs), termed the “100 mM fraction” from PMOG purification (6). Previous microarray (black bars) and current qPCR (white bars and green striped bars) measurements are shown for comparison.
FIG 4
FIG 4
(A) A schematic of the O-glycan-responsive BT4636-31 PUL showing the IGR deletion sequence. The full IGR sequence is shown in lowercase type with the deleted region shown in red and the retained ribosome binding site (RBS) shown in black. The respective stop (BT4635) and start (BT4634) codons are in uppercase type. (B) qPCR-based expression analysis of the wild-type and ΔBT4635-34 IGR B. thetaiotaomicron strains grown in PMOG as the only carbon source showing full PUL expression in the IGR deletion mutant. (C) Growth phase-specific expression profiles between wild-type and IGR deletion strains in a mixture of levan/PMOG. All other PMOG-responsive PULs previously tested were not altered during IGR deletion. All expression values are significant (P ≤ 0.05 by one-tailed Student’s t test) except those labeled in black. (D) Expression analysis from an experiment in which levan was introduced into cells actively growing on PMOG with the same strains shown in panel C and normalized to a no-carbon control as shown in Fig. 1C and F. (E) Fusion of a Bacteroides-adapted super-glo gfp (sg-gfp) reporter gene downstream of the BT4635-34 IGR sequence and its 118-bp deletion variant and a constitutively expressed gene (BT0658) in the ΔBT4635-34 IGR strain as a genetic background. The micrograph images at the bottom validate expression of this reporter. The values below the micrographs are the 16S rRNA gene-normalized expression values by qPCR in MM-glucose and MM-PMOG. The sg-gfp gene was adapted for expression in Bacteroides by making a translational fusion to the first eight codons of a host glycan-responsive susC-like gene, BT1042. This gene is expressed in response to PMOG and is also derepressed in a mutant lacking expression of a gene encoding an associated anti-σ factor, BT1052. Note that combined loss of BT1052 and growth in PMOG result in increased gfp expression as measured by both qPCR and cell fluorescence. Cells were exposed to oxygen on ice for 30 min prior to imaging to allow the green fluorescent protein (GFP) fluorophore to fold. (F) Relative expression differences between early and late growth phases for the sg-gfp reporter strains (with or without the full 129-bp IGR) grown in a mixture of levan/PMOG. Parallel measurements of the levan-responsive BT1763 gene and the O-glycan-responsive genes, BT4134 and BT4634 (here deprioritized in the ΔIGR background) serve as controls.
FIG 5
FIG 5
A model to explain the results reported in this study and based particularly on results of expression with the substrate at 100 mM. (Left) In the presence of preferred glycans, such as the CS and heparin glycosaminoglycans, PULs involved in catabolizing high-priority nutrients (red) are activated and liberate simple sugars that are ultimately transported into the cytoplasm, where they mediate repression of PULs that target lower-priority substrates. Since the PULs involved in degradation of some substrates that repress utilization of O-glycans can also be repressed in more-complex nutrient environments (26), it is possible that these gene clusters also harbor elements that mediate transcript repression via either the IGR-mediated mechanism described here or other unknown mechanisms. In the case of the nutrients present in the 100 mM fraction, the inducing substrate for the BT4355-59 PUL (green) is presumably present in either higher abundance and/or is more accessible, leading to deployment of this system early in growth. Alternatively, systems like BT4355-59 may be less susceptible to repression by monosaccharides present in certain high-priority substrates, which is consistent with the data shown in Fig. 1 and Fig. S1 in the supplemental material. (Right) After the preferred glycans are depleted and the corresponding repressive sugars are no longer present in the cytoplasm, expression of PULs that target low-priority glycans is released, but may require the action of other enzymes/Sus-like systems to uncover the glycan structure that is recognized by some systems such as that encoded by BT4636-31 (blue). (Left, inset) Thus, when the BT4636-31 IGR is absent during growth in the 100 mM substrate, repression is partially relieved (compare blue bars; P = 0.0007 by one-tailed Student’s t test). Since the BT4636-31 target ligand is sensed later in growth (Fig. 3), possibly because it is only enzymatically uncovered after the action of other systems, this system is not fully deployed early in growth even when its associated IGR is missing.

References

    1. El Kaoutari AE, Armougom F, Gordon JI, Raoult D, Henrissat B. 2013. The abundance and variety of carbohydrate-active enzymes in the human gut microbiota. Nat Rev Microbiol 11:497–504. doi: 10.1038/nrmicro3050. - DOI - PubMed
    1. McNeil NI. 1984. The contribution of the large intestine to energy supplies in man. Am J Clin Nutr 39:338–342. - PubMed
    1. Larsson JM, Karlsson H, Sjovall H, Hansson GC. 2009. A complex, but uniform O-glycosylation of the human MUC2 mucin from colonic biopsies analyzed by nanoLC/MSn. Glycobiology 19:756–766. doi: 10.1093/glycob/cwp048. - DOI - PubMed
    1. Johansson MEV, Sjövall H, Hansson GC. 2013. The gastrointestinal mucus system in health and disease. Nat Rev Gastroenterol Hepatol 10:352–361. doi: 10.1038/nrgastro.2013.35. - DOI - PMC - PubMed
    1. Martens EC, Roth R, Heuser JE, Gordon JI. 2009. Coordinate regulation of glycan degradation and polysaccharide capsule biosynthesis by a prominent human gut symbiont. J Biol Chem 284:18445–18457. doi: 10.1074/jbc.M109.008094. - DOI - PMC - PubMed

Publication types