. 2015 Dec 22;6(41):43927-43.
doi: 10.18632/oncotarget.5980.

Sorafenib, a multikinase inhibitor, induces formation of stress granules in hepatocarcinoma cells

Affiliations

Sorafenib, a multikinase inhibitor, induces formation of stress granules in hepatocarcinoma cells

Pauline Adjibade et al. Oncotarget. .

Abstract

Stress granules (SGs) are cytoplasmic RNA multimeric bodies that form under stress conditions known to inhibit translation initiation. In most reported stress cases, the formation of SGs was associated with the cell recovery from stress and survival. In cells derived from cancer, SGs formation was shown to promote resistance to either proteasome inhibitors or 5-Fluorouracil used as chemotherapeutic agents. Despite these studies, the induction of SGs by chemotherapeutic drugs contributing to cancer cells resistance is still understudied. Here we identified sorafenib, a tyrosine kinase inhibitor used to treat hepatocarcinoma, as a potent chemotherapeutic inducer of SGs. The formation of SGs in sorafenib-treated hepatocarcionoma cells correlates with inhibition of translation initiation; both events requiring the phosphorylation of the translation initiation factor eIF2α. Further characterisation of the mechanism of sorafenib-induced SGs revealed PERK as the main eIF2α kinase responsible for SGs formation. Depletion experiments support the implication of PERK-eIF2α-SGs pathway in hepatocarcinoma cells resistance to sorafenib. This study also suggests the existence of an unexpected complex regulatory balance between SGs and phospho-eIF2α where SGs dampen the activation of the phospho-eIF2α-downstream ATF4 cell death pathway.

Keywords: ATF4; PERK; eIF2a; sorafenib; stress granules.


Conflict of interest statement

CONFLICTS OF INTEREST

The authors declare no potential conflicts of interest

Figures

Figure 1
Figure 1. Sorafenib induces SGs in HCC
Hep3B and Huh-7 cells were treated with sorafenib (10 μM) for two hours or left untreated. A–C. Hep3B (A) and Huh-7 (B) were processed for immunofluorescence to detect SGs using antibodies specific to several SGs markers (FMRP, G3BP1, FXR1 and RACK1), or to P-bodies (RCK). Blue DAPI staining depicts nuclei. Scale bars are shown. The percentage of cells harboring SGs (>3 granules/cell) is indicated in (C). These representative results are from 50 different fields and 10 different experiments containing a total of 5000 cells. D. Hep3B were treated with both sorafenib (10 μM) and cycloheximide (100 μg / ml) for two hours and then were processed for immunofluorescence as above. DAPI stains for nuclei. The percentage of SGs-positive cells is indicated.
Figure 2
Figure 2. Analysis of eIF2α phosphorylation, ATF4 mRNA expression and localisation, and general translation initiation in sorafenib-treated HCC
A–D. Hep3B and Huh-7 were treated with sorafenib for two hours and then collected. (A) Protein content was analysed for the expression of phospho-eIF2α, phospho-ERK1/2, and ATF4 by western blot using specific antibodies. Tubulin and eIF2α serve as loading controls. (B) The amounts of phosphorylated eIF2α and ATF4 were determined by densitometry quantitation of the film signal using Image Studio™ Lite Software, normalised against total eIF2α and expressed as indicated. ****P < 0.0001 (Student's t-test). The results are representative of more than 5 different experiments. (C) Cytoplasmic extracts were prepared and fractionated on sucrose gradients. The indicated polysome profiles were monitored by measuring the OD254. (D) Hep3B and Huh-7 were treated with sorafenib for one hour and fifty minutes, then puromycin (50 μg/ml) was added for an additional ten minutes. Cells were collected and protein content was analysed by western blot for puromycin incorporation into nascent polypeptide chains using anti-puromycin antibodies (top panel). Coomassie Blue (bottom panel) staining shows equal protein loading. E. RNA content was isolated and the amount of ATF4 mRNA relative to Actin mRNA was quantified by real-time q(RT)-PCR using the ΔΔCt method. The results are presented as the mean of triplicate measurements, with error bars corresponding to the SEM. F–G. Cytoplasmic extracts of sorafenib-treated Hep3B and Huh-7 were prepared, fractionated on sucrose gradients and their polysomes profiles recorded (F) as above. (G) RNA content was isolated from pooled non-translating monosomal (pool 1), low translating polysomal (light polysomes; pool 2) and high translating polysomal (heavy polysomes; pool 3) fractions and analysed for levels of ATF4 mRNA by qRT-PCR using the ΔΔCt method. ATF4 mRNA levels were standardised against 18s ribosomal RNA and expressed as a percentage of total RNA. (G) The results are representatives of two independent experiments. H–I. FISH experiments. (H) untreated or sorafenib-treated Hep3B cells were fixed, permeabilised, and then incubated with 3 nM of an Alexa Fluor 488-labeled antisense RNA probe to detect ATF4 mRNA (panels 4 and 10) or with the Alexa Fluor 488-labeled sense probe as control (panels 1 and 7). SGs were detected using anti-G3BP1 antibodies (red signal). Merged pictures show a clear localisation of ATF4 mRNA signal in SGs. The percentage of cells harboring SGs positive for ATF4 mRNA is indicated at the right of panel 12. Shown are typical results from three different fields and two different experiments containing a total of 1000 cells. (I) Quantification of FISH signal. Densitometry quantification of FISH signal with Adobe Photoshop software. Pixels numbers and mean intensities were recorded for the selected regions (SGs, diffuse cytoplasm and background). The mean intensity was multiplied by the number of pixels for the region selected in order to obtain the absolute intensity. The absolute intensity of the background region was subtracted from each region of interest. Relative intensities were then calculated and correspond to the absolute intensities normalised to the absolute intensity of the reference.
Figure 3
Figure 3. Sorafenib induces SGs in MEFs
The indicated MEFs were treated with 25 μM of sorafenib (Sor) for two hours or left untreated (Unt). A–B. Cells were fixed and SGs were visualised by immunofluoresence using anti-FMRP and anti-FXR1 antibodies. Shown are merge pictures. Blue staining depicts nuclei. Representative results from 5 different fields and 4 different experiments containing a total of 1000 cells are shown. The percentage of cells harboring SGs (> 3 granules/cell) is indicated in (B). Scale bars are shown. C–D. Protein content of collected cells was analysed by western blot (C) for the amount of P-eIF2α and ATF4 using specific antibodies. eIF2α and tubulin serve as loading controls. (D) The amounts of phosphorylated eIF2α and ATF4 were determined by densitometry quantitation of the film signal, normalised against total eIF2α and tubulin, respectively and expressed as indicated. *P < 0.1, **P < 0.01, ***P < 0.001, and ****P < 0.0001 (Student's t-test). The results are representative of more than 3 different experiments. E. RNA content was isolated and the amount of ATF4 mRNA relative to GAPDH mRNA was quantified by real-time q(RT)-PCR using the ΔΔCt method. F. Localisation of murine ATF4 mRNA in sorafenib-induced SGs. The indicated MEFs were fixed, permeabilised, and then incubated with 3 nM of an Alexa Fluor 488-labeled antisense RNA probe to detect ATF4 mRNA (right panels) or with the Alexa Fluor 488-labeled sense probe as control (left panels). Shown are typical results from five different fields and two different experiments containing a total of 1000 cells.
Figure 4
Figure 4. PERK activation is required for sorafenib-induced SGs
A. Hep3B and HeLa were treated with sorafenib (10 μM) for 2 hours and with arsenite (150 μM) for 1 hour, respectively. Cells were collected and protein extracts analysed by western blot for the amounts of PERK, HRI and P-eIF2α. eIF2α serves as loading control. Red arrow denotes the supershifted migration of PERK in sorafenib-treated Hep3B indicating its activation. Activated HRI in arsenite-treated HeLa cells is indicated by a blue arrow. B. Hep3B and Huh-7 were treated with sorafenib (10 μM) for 2 hours. Cells were collected and protein extracts analysed by western blot for the activation of PERK as in (A). Red arrow denotes the supershifted migration of PERK in indicating its hyperactivation in Hep3B as compared to Huh-7, treated with sorafenib. C–F. Hep3B were treated with two specific PERK siRNAs for seventy-two hours and then incubated with sorafenib for two hours. (C) Cells were collected and protein content of collected cells was analysed by western blot for the expression of PERK, the phosphorylation of eIF2α and the amount of ATF4 using the corresponding antibodies. eIF2α serves as loading control. (D) The amounts of phosphorylated eIF2α and ATF4 were determined by densitometry quantitation of the film signal, normalised against total eIF2α and tubulin, respectively, and expressed as above. ***P < 0.001, and ****P < 0.0001 (Student's t-test). The results are representative of more than 3 different experiments. (E-F) Cells were processed for immunofluorescence to detect SGs using anti-FMRP and anti-FXR1 antibodies. DAPI stains nuclei. Shown in (E) are the merge pictures. Scale bars are shown. Representative results from 5 different fields and 5 different experiments containing a total of 1000 cells are shown. The percentage of cells harboring SGs (>3 granules/cell) is indicated in (F).
Figure 5
Figure 5. The activation of PERK-P-eIF2α-SGs pathway correlates with HCC resistance to sorafenib
A–C. SGs-forming Hep3B are more resistant to sorafenib than SGs-deficient Huh-7. Hep3B and Huh-7 were treated with sorafenib (10 μM) for twenty four hours. (A-B) Cells were analysed by staining with annexin V-FITC and propidium iodide (PI) in flow cytometry. The percentage of apoptotic cells (right boxes) is indicated in (B) and is the means +/− s.e.m., from three independent experiments. ****P < 0.0001 (Student's t-test). (C) Clonogenic survival assays. Sorafenib-treated Hep3B were trypsinised, counted, replated in the absence of drug, and incubated for 10 days. Populations >20 cells were counted as one surviving colony. Data were calculated as the percentage of surviving colonies relative to the number found in control (untreated) plates. Results are expressed as the mean of triplicate measurements. ****P < 0.0001 (Student's t-test). D–F. Hep3B were treated with either control, or PERK, or ATF4 siRNAs for seventy-two hours. Cells were then incubated with sorafenib for twenty-four hours. The survival of Hep3B was assessed by the clonogenic assay as above. Representative results are shown in (D) with the indicated statistical calculation in (E). (F) SiRNA-treated Hep3B were collected following sorafenib treatment and their protein content was analysed by western blot to assess the depletion of both PERK and ATF4 using the corresponding antibodies.
Figure 6
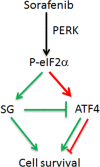
Figure 6. Model for the cross-talk between SGs and eIF2α phosphorylation in sorafenib-treated HCC
In this model, sorafenib treatment of HCC activates PERK, which through phosphorylating eIF2α triggers both SGs formation and ATF4 expression. The association of ATF4 mRNA with SGs dampens however its overproduction, thereby contributing to HCC resistance to sorafenib.

References

    1. Moeller B.J, Cao Y, Li C.Y, Dewhirst M.W. Radiation activates HIF-1 to regulate vascular radiosensitivity in tumors: role of reoxygenation, free radicals, and stress granules. Cancer Cell. 2004;5:429–441. - PubMed
    1. Gardner L.B. Hypoxic inhibition of nonsense-mediated RNA decay regulates gene expression and the integrated stress response. Mol Cell Biol. 2008;28:3729–3741. - PMC - PubMed
    1. Fournier M.J, Coudert L, Mellaoui S, Adjibade P, Gareau C, Cote M.F, Sonenberg N, Gaudreault R.C, Mazroui R. Inactivation of the mTORC1-eukaryotic translation initiation factor 4E pathway alters stress granule formation. Molecular and cellular biology. 2013;33:2285–2301. - PMC - PubMed
    1. Fournier M.J, Gareau C, Mazroui R. The chemotherapeutic agent bortezomib induces the formation of stress granules. Cancer cell international. 2010;10:12. - PMC - PubMed
    1. Mazroui R, Di Marco S, Kaufman R.J, Gallouzi I.E. Inhibition of the ubiquitin-proteasome system induces stress granule formation. Mol Biol Cell. 2007;18:2603–2618. - PMC - PubMed

Publication types

MeSH terms