. 2015 Oct 20:9:563.
doi: 10.3389/fnhum.2015.00563. eCollection 2015.

The coordination dynamics of social neuromarkers

Affiliations

The coordination dynamics of social neuromarkers

Emmanuelle Tognoli et al. Front Hum Neurosci. .

Abstract

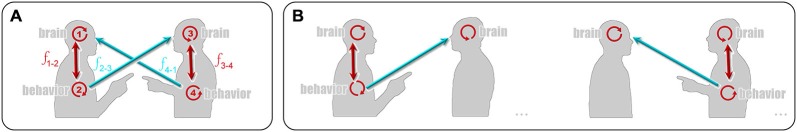
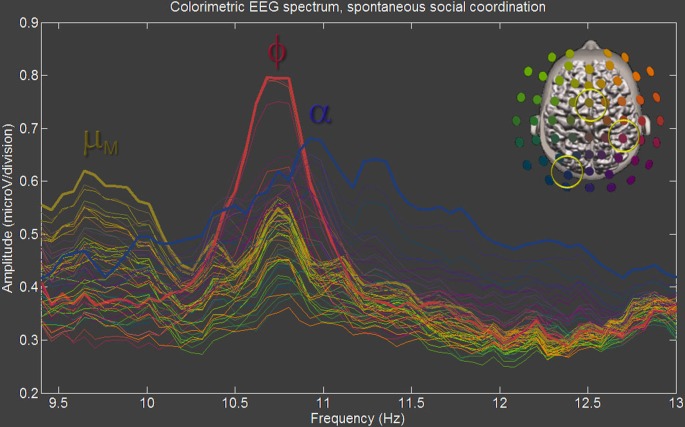
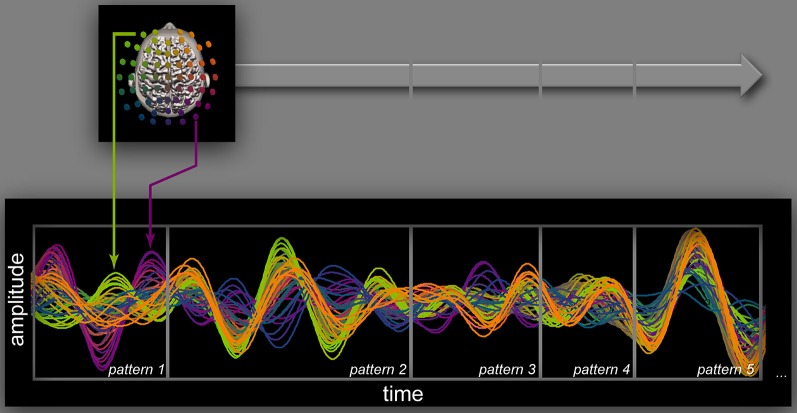
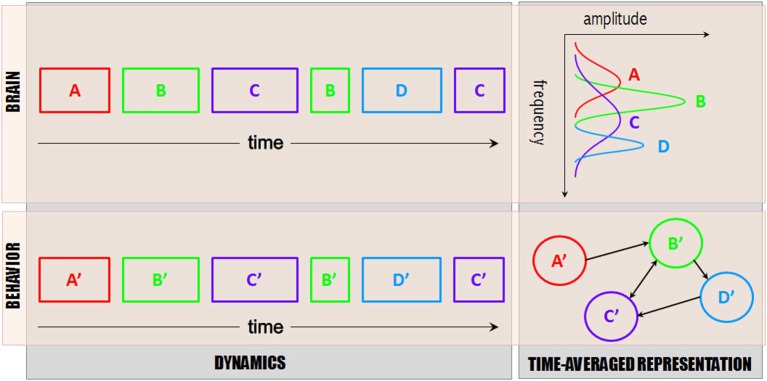
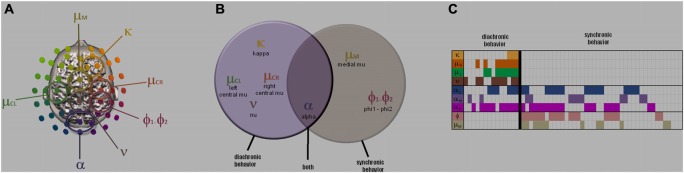
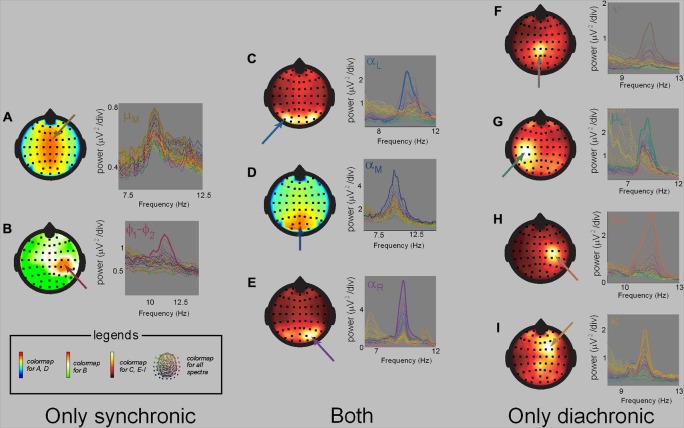
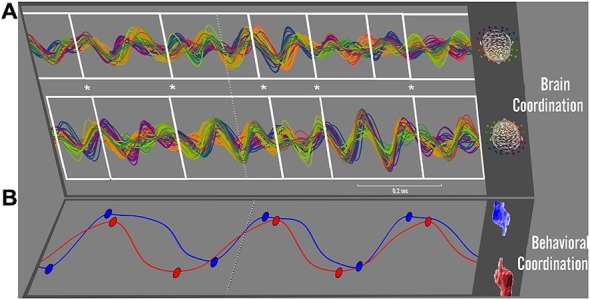
Social behavior is a complex integrative function that entails many aspects of the brain's sensory, cognitive, emotional and movement capacities. Its neural processes are seldom simultaneous but occur according to precise spatiotemporal choreographies, manifested by the coordination of their oscillations within and between brains. Methods with good temporal resolution can help to identify so-called "neuromarkers" of social function and aid in disentangling the dynamical architecture of social brains. In our ongoing research, we have used dual-electroencephalography (EEG) to study neuromarker dynamics during synchronic interactions in which pairs of subjects coordinate behavior spontaneously and intentionally (social coordination) and during diachronic transactions that require subjects to perceive or behave in turn (action observation, delayed imitation). In this paper, after outlining our dynamical approach to the neurophysiological basis of social behavior, we examine commonalities and differences in the neuromarkers that are recruited for both kinds of tasks. We find the neuromarker landscape to be task-specific: synchronic paradigms of social coordination reveal medial mu, alpha and the phi complex as contributing neuromarkers. Diachronic tasks recruit alpha as well, in addition to lateral mu rhythms and the newly discovered nu and kappa rhythms whose functional significance is still unclear. Social coordination, observation, and delayed imitation share commonality of context: in each of our experiments, subjects exchanged information through visual perception and moved in similar ways. Nonetheless, there was little overlap between their neuromarkers, a result that hints strongly of task-specific neural mechanisms for social behavior. The only neuromarker that transcended both synchronic and diachronic social behaviors was the ubiquitous alpha rhythm, which appears to be a key signature of visually-mediated social behaviors. The present paper is both an entry point and a challenge: much work remains to determine the nature and scope of recruitment of other neuromarkers, and to create theoretical models of their within- and between-brain dynamics during social interaction.

Keywords: alpha; brain rhythms; complexity; coordination dynamics; mu; phi complex; social coordination.


Figures

Figure 1
Figure 1
Task settings. The flow of information during synchronic (A), and diachronic (B) social interactions in a dyadic setting. Circular red arrows describe intrinsic dynamics in neural and behavioral subsystems respectively. Straight red arrows describe movement and perceptual information flows that are circumscribed to an individual; blue arrows represent information flows that cross to the other individual (social coupling). During synchronic social behaviors (A), information flows bidirectionally between all parts of the system. In contrast, during diachronic social behavior (B), only one person acts at a given time and one behavioral subsystem is disengaged. The two vignettes in (B) illustrate turns of behavior between the two individuals. See details in text.
Figure 2
Figure 2
Parsing neuromarkers. Neuromarkers can be parsed using multi-electrode spectra with high spectral resolution (here bin size is 0.06 Hz) and colorimetric encoding of spatial organization (following colorimetric legend shown in upper right corner). In this figure adapted from Tognoli et al. (2007a), sampled from a subject performing spontaneous social coordination -a synchronic task- 3 neuromarkers are observed that include mu medial (appearing in brown color as a result of its fronto-central topography), left alpha (blue, left occipital region) and phi (burgundy, right centro-parietal region). Note spectral proximity, especially for phi and alpha. Neuromarkers are quantified by identifying the boundaries of spectral peaks, when power departs from and returns to background power, and by integrating power over all the bins included in this interval (see supplementary materials S4).
Figure 3
Figure 3
Brain dynamics. A sequence of five oscillatory patterns segmented from continuous, band-pass filtered EEG in a synchronic task of intentional social coordination. Filters (7–13.5Hz) were set to retain activity in the 10 Hz range, a prominent feature of human waking EEG. Patterns were segmented manually by two trained examiners who analyzed the spatiotemporal evolution of phase aggregates (Benites et al., 2010). Results were later confirmed using an automatic segmentation algorithm. Each pattern inside the gray frames is best explained by the transient organization of a few macroscopic ensembles that interact through phase-locking or metastability. For instance, the first pattern shows phase aggregates that are suggestive of one gyral and one sulcal source (green and magenta arrows respectively; source estimation provides some indication on their cortical origin). Short-lived configurations tend to succeed one another (e.g., magenta phase aggregate ends with the edge of the first box, giving way to new phase aggregates in the second gray box). Putatively, this organization provides support for ongoing functional processes. Note that such neural organization in the 10 Hz frequency band sustains transient patterns with a typical duration of 1–200 ms, a crucial time-scale for human behavior, both individual and social.
Figure 4
Figure 4
Brain~behavior scheme. Dynamical descriptions of brain functional networks (top left) and inferred functional processes (bottom left), along with their time-averaged representation (functional graph on lower right and power spectrum on the upper right (note rotated axes to reflect the fact that amplitude is largely inherited from the cumulative duration of the patterns, along with their frequency consistency over time). For simplicity, only one frequency band is represented (say, 10 Hz), and only one process at a time (i.e., no network interaction). In reality, multiple frequency bands (and associated functional processes) occur at the same time. Typically, networks are co-activated and exhibit transient interactions, e.g., via phase locking and metastability. The goal of functional inference is to identify the functional processes (bottom rectangles) that match spatiotemporal patterns of brain activity (top rectangles) and their temporal footprints, so that correspondences between brain and behavior can be uncovered. Though simplistic, a translational language along these lines would propel our understanding of social brain functions and lead the way toward explanatory models.
Figure 5
Figure 5
The neuromarker repertoire. Overview of neuromarkers contributing to social behavior obtained from meta-analysis of three studies (supplementary materials S1-S3). (A) shows their scalp topography, (B) a Venn diagram of their recruitment in studies of synchronic and diachronic social behavior, and (C) a meta-analytic table of their interindividual occurrence. Neuromarker location in (A) indicates sensor carrying highest power on the scalp, keeping in mind that this does not imply regional homology with underlying cortical structures. Each column of (C) specifies one of fifty four subjects enrolled in our experiments of social behavior, each row corresponding to a neuromarker. When a neuromarker was detected in a subject, its cell is marked with a color, else it is left blank. Note empty sectors in the lower left and upper right sectors that suggest specific neuromarker landscape for the two types of social behaviors.
Figure 6
Figure 6
Task-specific neuromarkers. Spatial and spectral properties of the neuromarkers referenced in Table 2 (adapted from Tognoli et al., ; Suutari et al., 2010). On the left (A–B) are neuromarkers mu medial (A) and phi (B), that were only observed in synchronic tasks. On the right are neuromarkers nu (F), left and right mu (G,H) and kappa (I), that were only observed in diachronic tasks. (C–E) has alpha neuromarkers that were observed in both types of task, and shows the medial form (D), and its lateralized variants, emphasizing the left (C) and right hemisphere (E). Neuromarker discovery is aided by the color of their spectra, which are not chosen arbitrarily but inherited from neuromarker’s spatial organization.
Figure 7
Figure 7
Brain~behavior coordination. Synchronized patterns between brains, in a synchronic behavior of intentional social coordination (after Tognoli et al., 2007b). Continuous dual-EEG is shown in the 10 Hz frequency band for a pair of interacting subjects in (A), with electrode signals encoded using the colorimetric legend shown on the right (EEG from one subject on top, the other on the bottom). Changes in spatiotemporal organization of brainwaves were determined by two trained examiners who were blind to the associated behavioral variables (Benites et al., 2010). A manual segmentation was performed separately on each subject’s EEG. Transitions are marked by successive white frames, following the method outlined in Section “The neuromarker framework: brain coordination dynamics” and Figure 3. In this sample trial, subjects were instructed to coordinate finger movements inphase (see red and blue movement trajectories of right index fingers in B). The dashed line in (B) indicates the moment at which they successfully coordinated their behavior (with the movements’ relative phase exhibiting a sudden phase transition to inphase, not shown). The entire temporal window displayed is about 1 s long and relates to the intentional transition process from independent to coordinated behavior. In this window, the transition between subjects’ brain patterns reveals strong tendencies for coincidence (see series of asterisks in (A), cueing temporal proximity of each subject’s brain pattern transitions). Note that the dynamic patterns of each participant’s brain activity have distinct spatial, spectral, and phase organization. Neural transitions are coupled, but not the spatiotemporal neural patterns located between them.

Similar articles

Cited by

References

    1. Adolphs R. (2009). The social brain: neural basis of social knowledge. Annu. Rev. Psychol. 60, 693–716. 10.1146/annurev.psych.60.110707.163514 - DOI - PMC - PubMed
    1. Anderson S. W., Bechara A., Damasio H., Tranel D., Damasio A. R. (1999). Impairment of social and moral behavior related to early damage in human prefrontal cortex. Nat. Neurosci. 2, 1032–1037. 10.1038/14833 - DOI - PubMed
    1. Arnstein D., Cui F., Keysers C., Maurits N. M., Gazzola V. (2011). μ suppression during action observation and execution correlates with BOLD in dorsal premotor, inferior parietal and SI cortices. J. Neurosci. 31, 14243–14249. 10.1523/JNEUROSCI.0963-11.2011 - DOI - PMC - PubMed
    1. Avanzini P., Fabbri-Destro M., Dalla Volta R., Daprati E., Rizzolatti G., Cantalupo G. (2012). The dynamics of sensorimotor cortical oscillations during the observation of hand movements: an EEG study. PLoS One 7:e37534 10.1371/journal.pone.0037534 - DOI - PMC - PubMed
    1. Babiloni C., Babiloni F., Carducci F., Cincotti F., Cocozza G., Del Percio C., et al. . (2002). Human Cortical Electroencephalography (EEG) rhythms during the observation of simple aimless movements: a high-resolution EEG study. Neuroimage 17, 559–572. 10.1006/nimg.2002.1192 - DOI - PubMed