. 2015 Oct 21:3:166.
doi: 10.3389/fbioe.2015.00166. eCollection 2015.

Lifetime Distributions from Tracking Individual BC3H1 Cells Subjected to Yessotoxin

Affiliations

Lifetime Distributions from Tracking Individual BC3H1 Cells Subjected to Yessotoxin

Mónica Suárez Korsnes et al. Front Bioeng Biotechnol. .

Abstract

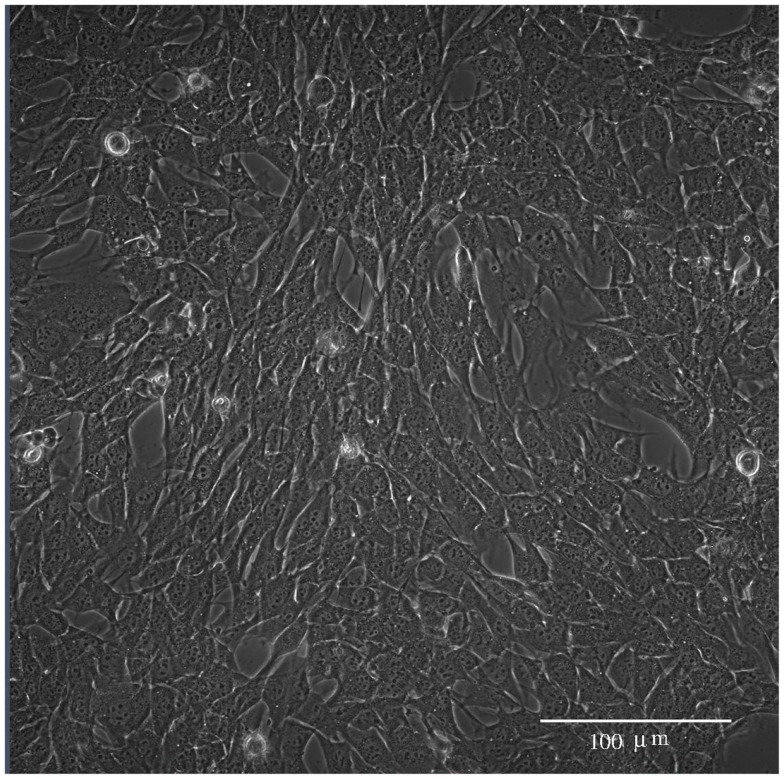
This work shows examples of lifetime distributions for individual BC3H1 cells after start of exposure to the marine toxin yessotoxin (YTX) in an experimental dish. The present tracking of many single cells from time-lapse microscopy data demonstrates the complexity in individual cell fate and which can be masked in aggregate properties. This contribution also demonstrates the general practicality of cell tracking. It can serve as a conceptually simple and non-intrusive method for high throughput early analysis of cytotoxic effects to assess early and late time points relevant for further analyzes or to assess for variability and sub-populations of interest. The present examples of lifetime distributions seem partly to reflect different cell death modalities. Differences between cell lifetime distributions derived from populations in different experimental dishes can potentially provide measures of inter-cellular influence. Such outcomes may help to understand tumor-cell resistance to drug therapy and to predict the probability of metastasis.

Keywords: cell death; cell tracking; inter-cellular influence; lifetime statistics; yessotoxin.


Figures

Figure 1
Figure 1
Phase contrast image of BC3H1 cells short after YTX exposure.
Figure 2
Figure 2
Example of subsequent images of BC3H1 cells exposed to 100 nM YTX. Images taken at 2.5 min interval. The time of image 1 is 30 h treatment after exposure to YTX. The white arrow illustrates tracking of a cell, which dies during the time of image 6–9.
Figure 3
Figure 3
Two sequences of four images respectively showing typical apoptotic- and necrotic-like death events among BC3H1 cells exposed to yessotoxin. The necrotic-like cell death process is much slower than the apoptotic-like cell death.
Figure 4
Figure 4
Kernel density estimates of distributions of lifetimes of BC3H1 cells after YTX exposure at concentrations 100 and 200 nM. Vertical bars indicate individual observations (samples).
Figure 5
Figure 5
Results from mixed Weibull analysis giving estimates of distributions of lifetimes of BC3H1 cells after YTX exposure at concentrations 100 and 200 nM. The parameters for the mixed Weibull distribution (k and λ) result from model fit to the empirical cumulative distribution (right). Red vertical bars indicate individual observations (samples). The smoothed histograms K1.0 × m and K0.5 × m [cf Eq. (3)] are here for visual control and illustration.
Figure 6
Figure 6
Kernel density estimates of distributions of lifetimes in four separate populations of BC3H1 cells after exposed to 100 nM YTX (i.e., each of the four populations were in separate experimental wells). Influence between cells in the same well may explain the difference between the distributions. These variations between distributions can, therefore, potentially provide measures of such inter-cellular influence.

References

    1. Alfonso A., de la Rosa L., Vieytes M. R., Yasumoto T., Botana L. M. (2003). Yessotoxin, a novel phycotoxin, activates phosphodiesterase activity: effect of yessotoxin on cAMP levels in human lymphocytes. Biochem. Pharmacol. 65, 193–208.10.1016/S0006-2952(02)01454-5 - DOI - PubMed
    1. Alonso E., Rubiolo J. A. (2015). “Therapeutics of marine toxins,” in Phycotoxins, Chemistry and Biochemistry, eds Botana L. M., Alfonso A. (Chichester: John Wiley & Sons, Ltd.), 181–201.10.1002/9781118500354.ch8 - DOI
    1. Alonso E., Vale C., Vieytes M. R., Botana L. M. (2013). Translocation of PKC by yessotoxin in an in vitro model of Alzheimer disease with improvement of tau and β-amyloid pathology. ACS Chem. Neurosci. 4, 1062–1070.10.1021/cn400018y - DOI - PMC - PubMed
    1. Basu S., Kolouri S., Rohde G. K. (2014). Detecting and visualizing cell phenotype differences from microscopy images using transport-based morphometry. Proc. Natl. Acad. Sci. U.S.A. 111, 3448–3453.10.1073/pnas.1319779111 - DOI - PMC - PubMed
    1. Becskei A., Kaufmann B. B., van Oudenaarden A. (2005). Contributions of low molecule number and chromosomal positioning to stochastic gene expression. Nat. Genet. 37, 937–944.10.1038/ng1616 - DOI - PubMed

LinkOut - more resources