. 2015 Nov 9:6:24.
doi: 10.1186/s13293-015-0043-9. eCollection 2015.

Sex differences in protein expression in the mouse brain and their perturbations in a model of Down syndrome

Affiliations

Sex differences in protein expression in the mouse brain and their perturbations in a model of Down syndrome

Aaron Block et al. Biol Sex Differ. .

Abstract

Background: While many sex differences in structure and function of the mammalian brain have been described, the molecular correlates of these differences are not broadly known. Also unknown is how sex differences at the protein level are perturbed by mutations that lead to intellectual disability (ID). Down syndrome (DS) is the most common genetic cause of ID and is due to trisomy of human chromosome 21 (Hsa21) and the resulting increased expression of Hsa21-encoded genes. The Dp(10)1Yey mouse model (Dp10) of DS is trisomic for orthologs of 39 Hsa21 protein-coding genes that map to mouse chromosome 10 (Mmu10), including four genes with known sex differences in functional properties. How these genes contribute to the DS cognitive phenotype is not known.

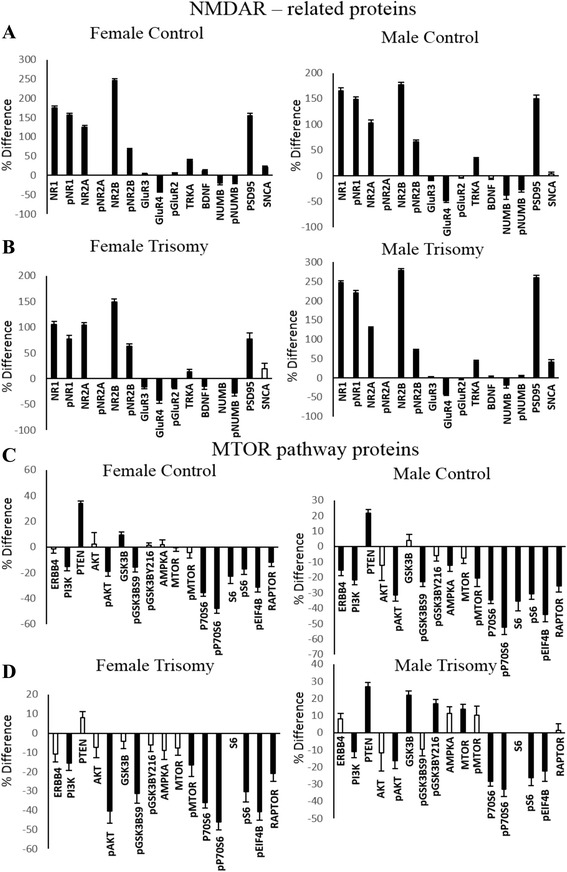
Methods: Using reverse phase protein arrays, levels of ~100 proteins/protein modifications were measured in the hippocampus, cerebellum, and cortex of female and male controls and their trisomic Dp10 littermates. Proteins were chosen for their known roles in learning/memory and synaptic plasticity and include components of the MAPK, MTOR, and apoptosis pathways, immediate early genes, and subunits of ionotropic glutamate receptors. Protein levels were compared between genotypes, sexes, and brain regions using a three-level mixed effects model and the Benjamini-Hochberg correction for multiple testing.

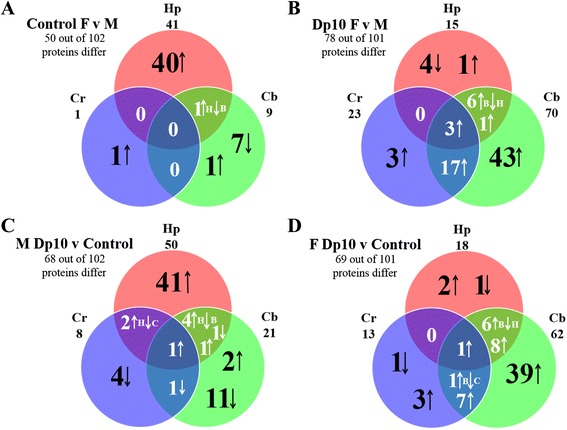
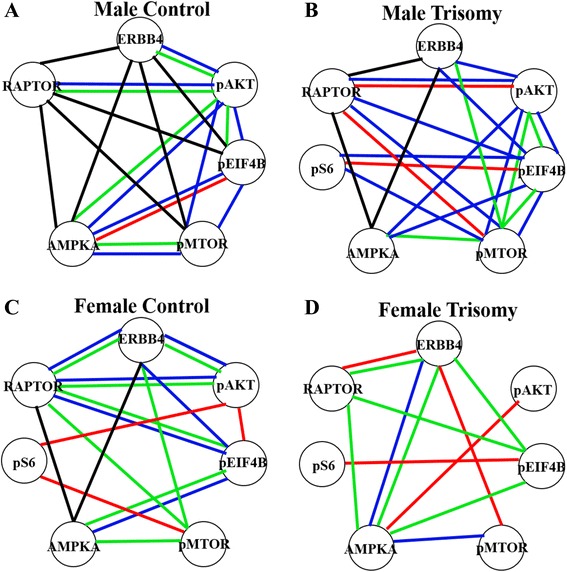
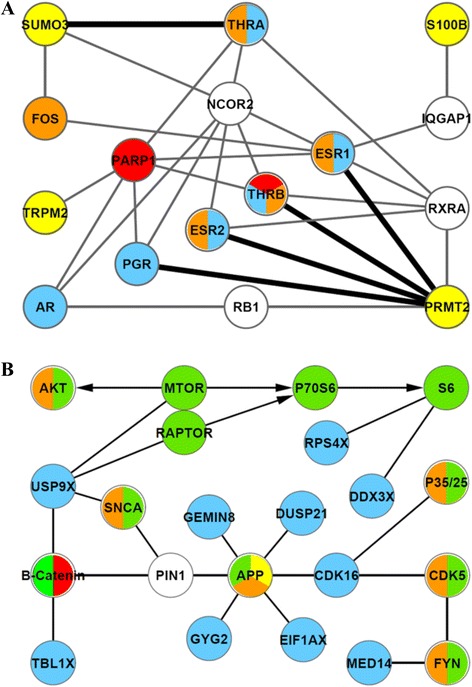
Results: In control mice, levels of approximately one half of the proteins differ significantly between females and males in at least one brain region; in the hippocampus alone, levels of 40 % of the proteins are significantly higher in females. Trisomy of the Mmu10 segment differentially affects female and male profiles, perturbing protein levels most in the cerebellum of female Dp10 and most in the hippocampus of male Dp10. Cortex is minimally affected by sex and genotype. Diverse pathways and processes are implicated in both sex and genotype differences.

Conclusions: The extensive sex differences in control mice in levels of proteins involved in learning/memory illustrate the molecular complexity underlying sex differences in normal neurological processes. The sex-specific abnormalities in the Dp10 suggest the possibility of sex-specific phenotypic features in DS and reinforce the need to use female as well as male mice, in particular in preclinical evaluations of drug responses.

Keywords: Cerebellum; Dp(10)1Yey; Hippocampus; Intellectual disability; Learning and memory deficits; Mouse chromosome 10; S100B; TRPM2; Trisomy 21.


Figures

Fig. 1
Fig. 1
Distribution and overlaps of sex and genotype protein differences among brain regions. The number of proteins showing different levels in at least one brain region and the total number of proteins measured in each comparison are provided in each panel. In each Venn diagram, the total number of proteins that differed is indicated under the name of the brain region. Pink hippocampus (Hp), green cerebellum (Cb), blue cortex (Cr). Arrows within the Venn diagram circles indicate increases and decreases in the respective ratios. H hippocampus, B cerebellum, C cortex. a Female controls vs. male controls. b Female Dp10 vs. male Dp10. c Male Dp10 vs. male controls. d Female Dp10 vs. female controls
Fig. 2
Fig. 2
Sex and genotype differences in levels of selected Hsa21-encoded proteins. Bar graphs indicate the percent (%) increase or decrease in each comparison. HP hippocampus, CB cerebellum, CR cortex, C controls, females vs. males; T trisomic (Dp10) females vs. Dp10 males; M male Dp10 vs. male controls; F female Dp10 vs. female controls. Asterisk significant difference by three-level mixed effects model after Benjamini-Hochberg correction, with 5 % false discovery rate. n, not measured. Error bars indicate the SEM. ac Proteins are encoded by genes trisomic in the Dp10 mice. d, e Genes encoding APP and ITSN1 map to Mmu16 and PKNOX1 maps to Mmu17 and are not trisomic in the Dp10
Fig. 3
Fig. 3
Sex and genotype differences in levels of components of the MTOR pathway in the hippocampus and cerebellum. Legend as in Fig. 2
Fig. 4
Fig. 4
Sex and genotype differences in levels of selected proteins in cortex. Legend as in Fig. 2
Fig. 5
Fig. 5
Ratio of protein levels in hippocampus and cerebellum. a NMDAR subunits and related proteins in female and male control mice. b NMDAR subunits and related proteins in female and male Dp10 mice. c Components of the MTOR pathway in female and male control mice. d Components of the MTOR pathway in female and male Dp10 mice. Y axis % difference in hippocampus vs. cerebellum. Black bars significant difference, white bars non-significant difference
Fig. 6
Fig. 6
Correlation of levels of MTOR pathway components across brain regions. Correlation coefficients for proteins in each brain region and sex/genotype were determined using Spearman correlation analysis. Networks include only those protein pairs with r > 0.8 and p < 0.05, after manual inspection to exclude spurious linearities. Red correlations in hippocampus, blue cerebellum, green cortex, black all three brain regions. a Male controls. b Male Dp10. c Female controls. d Female Dp10
Fig. 7
Fig. 7
Protein interaction networks. Protein interactions, retrieved from curated public databases, are indicated by lines connecting two nodes. Nodes are color-coded: yellow Hsa21-encoded protein, red human ID protein [18], orange mouse LM protein (The Mammalian Phenotype Database). a Interactions between Hsa21 proteins and sex or thyroid hormone receptors (blue); heavy lines direct interactions with a Dp10 protein. b Interactions of RPPA proteins (green) that showed an abnormal level in at least one brain region/sex/genotype with X chromosome-encoded proteins (blue) that escape silencing by X inactivation [–12]. Arrows indicate activation in the MTOR pathway

Similar articles

Cited by

References

    1. Jazin E, Cahill L. Sex differences in molecular neuroscience: from fruit flies to humans. Nat Rev Neurosci. 2010;11:9–17. doi: 10.1038/nrn2754. - DOI - PubMed
    1. McCarthy MM, Arnold AP, Ball GF, Blaustein JD, De Vries GJ. Sex differences in the brain: the not so inconvenient truth. J Neurosci. 2012;32:2241–7. doi: 10.1523/JNEUROSCI.5372-11.2012. - DOI - PMC - PubMed
    1. Duarte-Guterman P, Yagi S, Chow C, Galea LA. Hippocampal learning, memory, and neurogenesis: effects of sex and estrogens across the lifespan in adults. Horm Behav. 2015;74:37–52. doi: 10.1016/j.yhbeh.2015.05.024. - DOI - PubMed
    1. Maeng LY, Waddell J, Shors TJ. The prefrontal cortex communicates with the amygdala to impair learning after acute stress in females but not in males. J Neurosci. 2010;30:16188–96. doi: 10.1523/JNEUROSCI.2265-10.2010. - DOI - PMC - PubMed
    1. Bao A-M, Swaab DF. Sex differences in the brain, behavior, and neuropsychiatric disorders. Neuroscientist. 2010;16:550–65. doi: 10.1177/1073858410377005. - DOI - PubMed

LinkOut - more resources