. 2015 Nov 11;10(11):e0142182.
doi: 10.1371/journal.pone.0142182. eCollection 2015.

Novel Activities of Select NSAID R-Enantiomers against Rac1 and Cdc42 GTPases

Affiliations

Novel Activities of Select NSAID R-Enantiomers against Rac1 and Cdc42 GTPases

Tudor I Oprea et al. PLoS One. .

Abstract

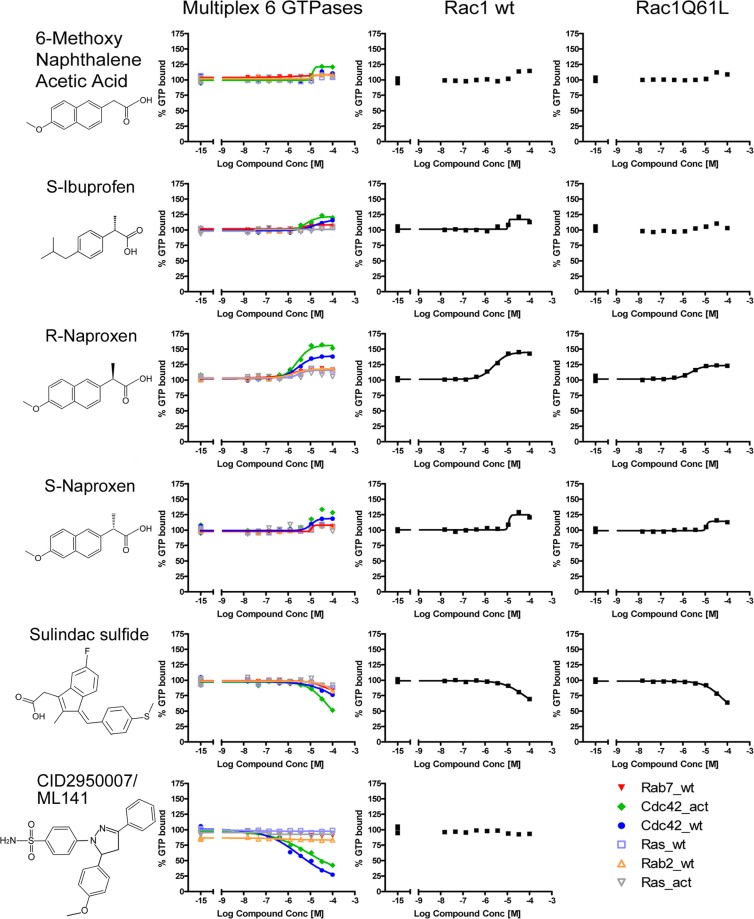
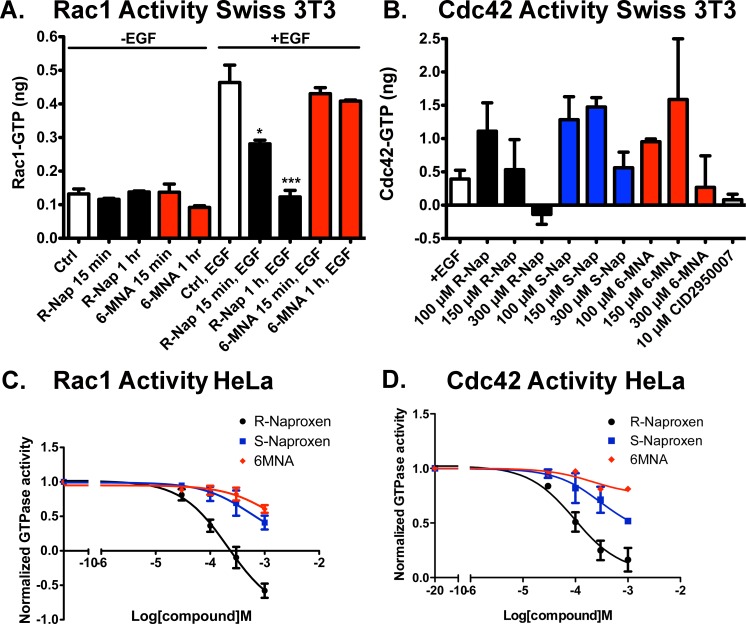
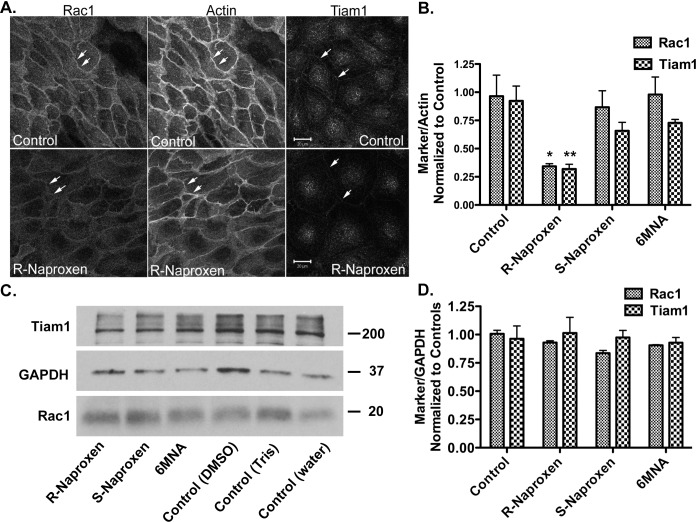
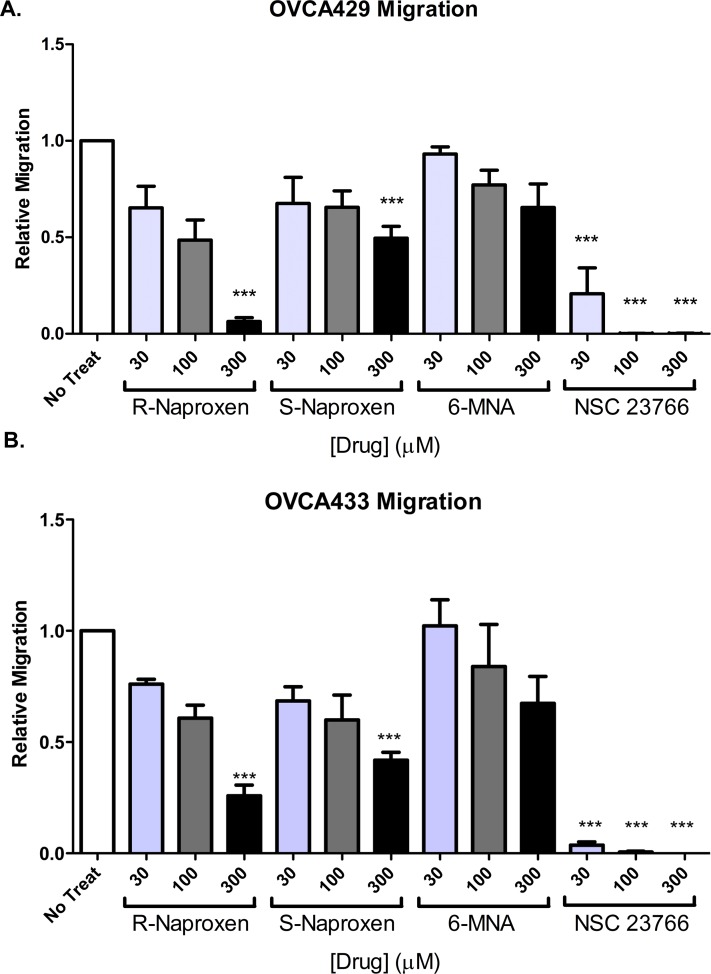
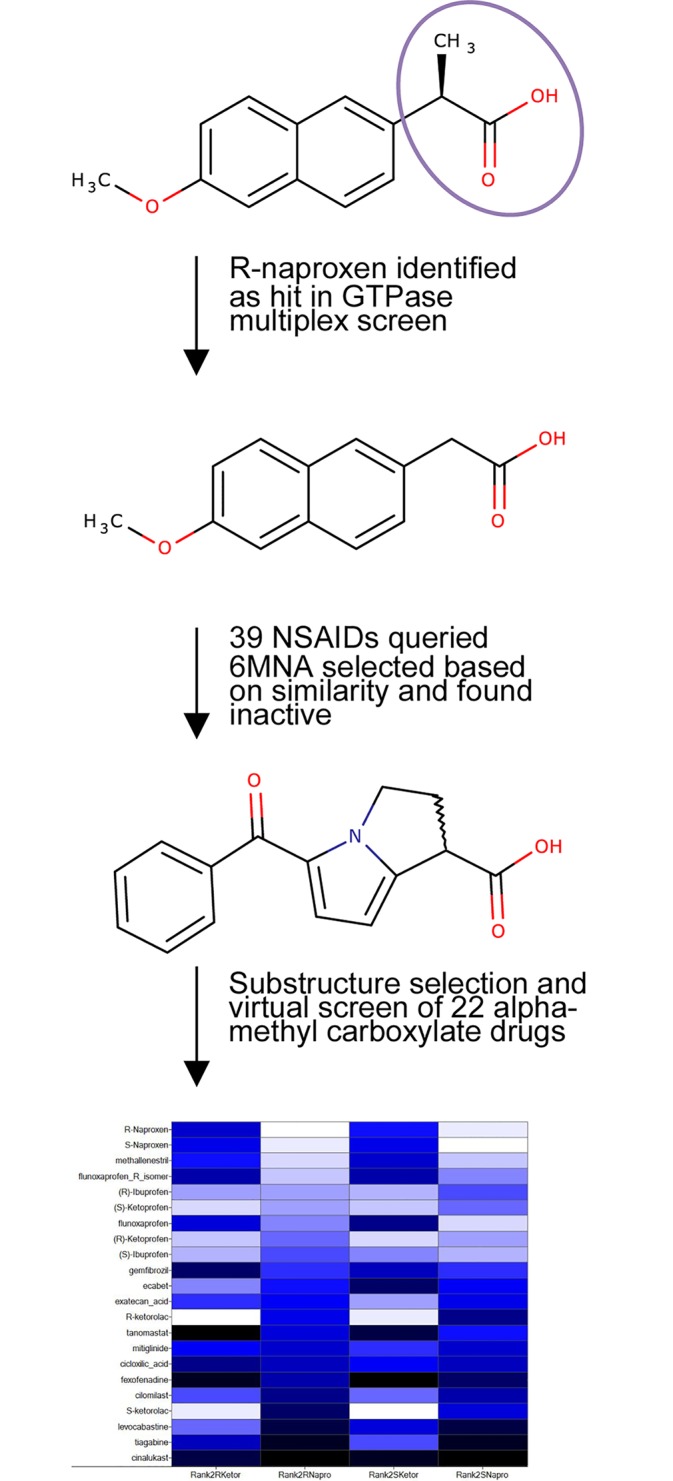
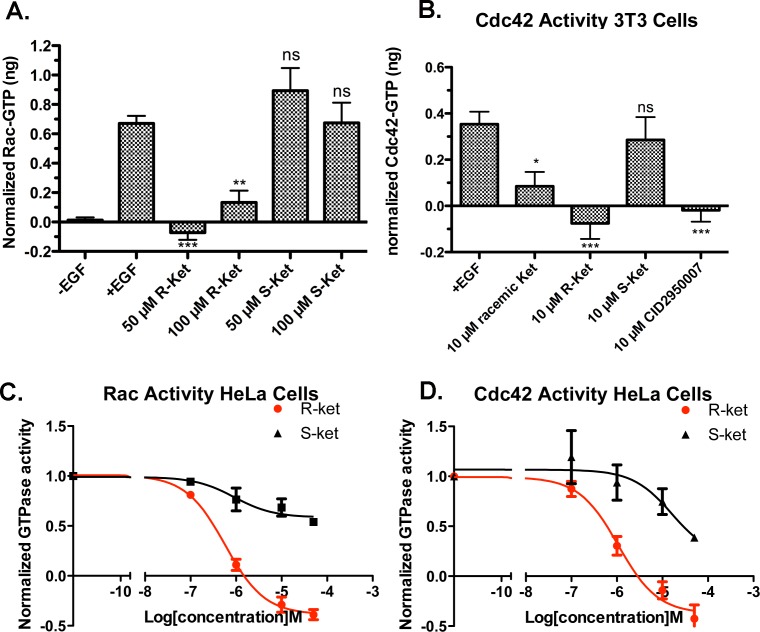
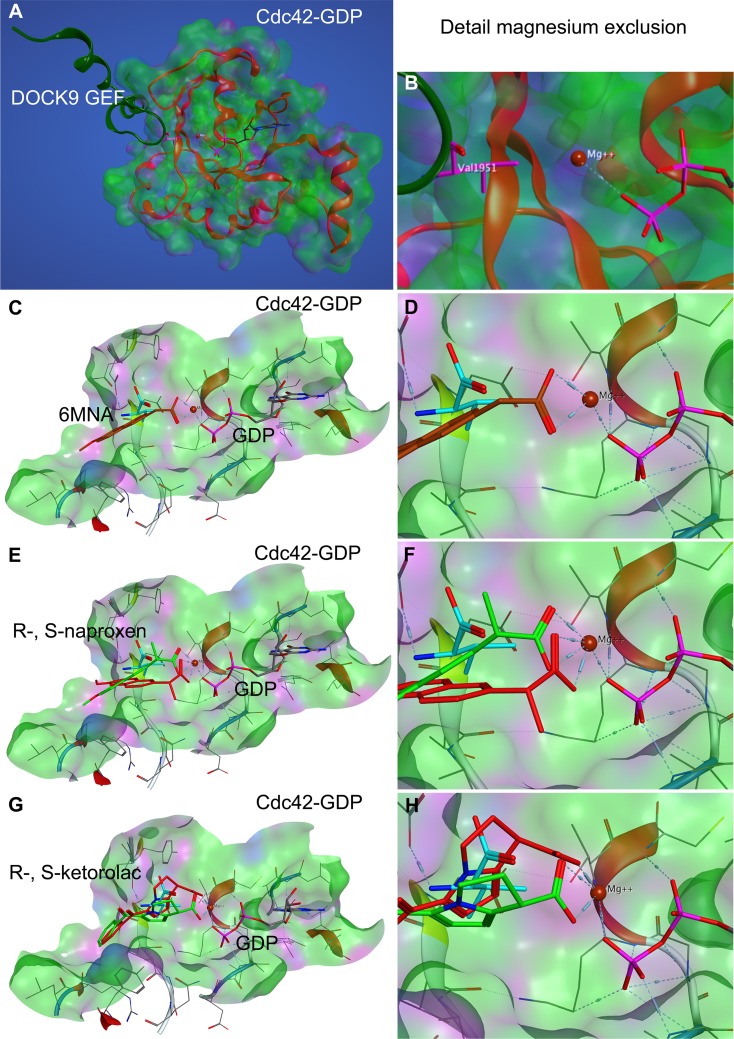
Rho family GTPases (including Rac, Rho and Cdc42) collectively control cell proliferation, adhesion and migration and are of interest as functional therapeutic targets in numerous epithelial cancers. Based on high throughput screening of the Prestwick Chemical Library® and cheminformatics we identified the R-enantiomers of two approved drugs (naproxen and ketorolac) as inhibitors of Rac1 and Cdc42. The corresponding S-enantiomers are considered the active component in racemic drug formulations, acting as non-steroidal anti-inflammatory drugs (NSAIDs) with selective activity against cyclooxygenases. Here, we show that the S-enantiomers of naproxen and ketorolac are inactive against the GTPases. Additionally, more than twenty other NSAIDs lacked inhibitory action against the GTPases, establishing the selectivity of the two identified NSAIDs. R-naproxen was first identified as a lead compound and tested in parallel with its S-enantiomer and the non-chiral 6-methoxy-naphthalene acetic acid (active metabolite of nabumetone, another NSAID) as a structural series. Cheminformatics-based substructure analyses-using the rotationally constrained carboxylate in R-naproxen-led to identification of racemic [R/S] ketorolac as a suitable FDA-approved candidate. Cell based measurement of GTPase activity (in animal and human cell lines) demonstrated that the R-enantiomers specifically inhibit epidermal growth factor stimulated Rac1 and Cdc42 activation. The GTPase inhibitory effects of the R-enantiomers in cells largely mimic those of established Rac1 (NSC23766) and Cdc42 (CID2950007/ML141) specific inhibitors. Docking predicts that rotational constraints position the carboxylate moieties of the R-enantiomers to preferentially coordinate the magnesium ion, thereby destabilizing nucleotide binding to Rac1 and Cdc42. The S-enantiomers can be docked but are less favorably positioned in proximity to the magnesium. R-naproxen and R-ketorolac have potential for rapid translation and efficacy in the treatment of several epithelial cancer types on account of established human toxicity profiles and novel activities against Rho-family GTPases.


Conflict of interest statement

Competing Interests: Awarded United States Patent and Trademark Office award 9,125,899. September 8, 2015. Title: “Modulators of GTPases and Their Use (NSAIDs).” Inventors: Angela Wandinger-Ness, Larry A. Sklar, Tudor I. Oprea, Laurie Hudson and Zurab Surviladze. STC (UNM’s Science and Technology Transfer office) has offered for license up to 21 technologies including potential pharmaceuticals to ieCrowd, Inc. R-ketorolac is one of the drugs in the portfolio. Larry A. Sklar is a coinventor of HyperCyt and cofounder of IntelliCyt, company that commercializes the platform. The authors hereby confirm that the disclosed competing interests do not alter their adherence to PLOS ONE policies on sharing data and/or materials.

Figures

Fig 1
Fig 1. Effects of Prestwick Chemical Library® compounds on guanine nucleotide binding by Ras-related GTPases.
Tests of 888 compounds identified select NSAIDs as active against guanine nucleotide binding measured as the % of BODIPY-GTP bound in the presence of added compound relative to DMSO treated controls. Dose response assays on eight Ras-related identified R-naproxen as having selective activity against multiple Rac and Cdc42 GTPases. CID2950007/ML141 is a characterized Cdc42 selective inhibitor that served as a positive control. Multiplex dose response assays conducted on eight Ras-related GTPases, under the same conditions as primary screens with Z’ ranging from 0.62 to 0.84, identified R-naproxen as having selective activity against multiple Rac and Cdc42 GTPases.
Fig 2
Fig 2. R-naproxen inhibits Rac and Cdc42 activation in response to growth factor stimulus of cells.
(A-B) GLISA effector binding assays were used to quantify Rac1 and Cdc42 GTPase activities in Swiss 3T3 fibroblast cell lysates following preincubation for varying times (15 min or 1 h) or with varying concentrations of R-naproxen, S-naproxen or 6MNA, with or without (+/-) 100 ng/ml EGF stimulation. In panel A, R-naproxen and 6-MNA were used at 300 μM and time of exposure varied as indicated. One-way ANOVA and Dunnett’s multiple comparison test shows select R-Naproxen samples significantly (*p<0.05, ***p<0.001) different from EGF stimulated controls. In panel B, drug doses ranged from 10–300 μM as indicated. CID2950007 is a selective inhibitor of Cdc42 and served as a positive control. N = 3–8. One-way ANOVA and Dunnett’s multiple comparison test did not identify significant differences relative to EGF-stimulated controls. (C-D) Flow cytometric G-trap assay was used to quantitatively assess dose dependent inhibition of Rac1 and Cdc42 activation in HeLa cells following 2 h pre-treatment with R-naproxen, S-naproxen or 6MNA (30–1000 μM) and 2 min EGF stimulation (100 ng/ml). The inhibition curves were fitted to the sigmoidal dose-response equation in GraphPad Prism 5. Quantification of three independent measurements are plotted ± SEM.
Fig 3
Fig 3. R-naproxen alters membrane localization of Rac1 and TIAM1 GEF.
(A) OvCa433 cells were left untreated or treated with R-naproxen (300 μM) for 24 h and subsequently fixed and multiply stained for Rac1, actin (phalloidin) and Tiam1. N = 3. See also Figure D in S1 File for time dependent loss of Rac1 membrane localization. N = 3 (B) Quantification of image intensity using Image J of 3 representative confocal images as shown in panel (A) containing 20–30 cells/field normalized to actin and untreated controls. (C) Western blot analyses of lysates from cells treated with 300 μM compound as indicated for 24 h as compared to untreated controls. 6-MNA (30 mM stock in DMSO), S-naproxen (30 mM stock in water), or R-naproxen (30 mM stock in 1 M Tris buffer, pH 8). Blots were probed for Tiam1 (200 kDa), GAPDH (37 kDa), Rac1 (20 kDa), as a loading control. (D) Quantification of image intensity using Image J. Each marker was normalized to GAPDH and untreated controls. N = 3. One-way ANOVA and Dunnett’s multiple comparison test shows select R-Naproxen samples significantly (*p<0.05, **p<0.01) different from controls.
Fig 4
Fig 4. R-naproxen inhibits migration of immortalized human ovarian cancer cells.
Cell migration was measured using a Boyden chamber assay. (A-B) Ovarian cancer (OvCa429 and OvCa433) cells were plated on filters and treated with 0–300 μM R-naproxen, S-naproxen, 6-MNA or the Rac1 inhibitor NSC23766 and then allowed to migrate for 48 h. Migrated cells were photographed and counted in three independent fields per chamber. N = 3 One-way ANOVA and Tukey's multiple comparison test shows values significantly (**P<0.01, ***P<0.001) different from untreated controls.
Fig 5
Fig 5. R-naproxen selectively inhibits invadopodia formation.
(A) Arrowheads indicate the three defining features of each invadopodia quantified: 1. Puncta of actin; 2. Degradation of FITC-fibronectin; 3. Puncta of Rac1 or cortactin; 4. Merge channels to ensure three factors convalesce. (B) Cells plated on FITC-fibronectin coated substrates were cultured with R-naproxen, 6 MNA, or left untreated, then EGF stimulated, and invadopodia quantified. Representative cells from each treatment condition are shown, with invadopodia quantified indicated by arrowheads. (C) Schematic of invadopodia assay. (D) Invadopodia were quantified based on local degradation of fibronectin substrate, and costaining with cortactin (not shown). N = 3, with N = 20 cells quantified per treatment condition. One-way ANOVA and Dunnett’s multiple comparison test shows R-Naproxen samples significantly (**p<0.001) different from control and 6MNA.
Fig 6
Fig 6. R-naproxen acts via a COX-independent mechanism.
OvCa433 cells were left untreated (BSA only) or incubated with or without 300 μM of S-naproxen or R-naproxen for 48 h. Thereafter, stimulation was for 10 min with EGF where indicated. Cell lysates were resolved by SDS-PAGE and immunoblotted for phosphorylated EGFR (pEGFR) or phosphorylated ERK (pERK). Phosphorylation of EGFR and ERK were determined in the presence of S-naproxen (SN) or R-naproxen (RN), without (BSA) or with EGF (EGF). Shown are western blots probed with phospho-specific antibodies for (A) pEGFR and (C) pERK relative to immunoblots for total EGFR or ERK proteins. Bar graphs show quantification of each phosphoprotein by densitometry and normalized to total protein (measured either by immunoblot or via Coomassie staining) (B) pEGFR/total protein and (D) pERK/total protein or total ERK. N = 2 One-way ANOVA and Tukey’s multiple comparison test shows EGF-stimulated samples +/- drug values significantly (*p<0.05, **p<0.01, ***p<0.001) different from BSA controls as indicated on the graph. Unstimulated samples +/- drug were not statistically different when compared pairwise and the same was true for pairwise comparisons of stimulated samples +/- drug.
Fig 7
Fig 7. Schema of structure activity evaluation and substructure selection for virtual screen.
Differential activities in cell based studies of the chemically related structural series encompassing R-naproxen, S-naproxen and 6-MNA prompted focus on the α-methyl carboxylate as a critical structural determinant. With R-naproxen as a query and focusing on α-methyl carboxylates, we evaluated all approved NSAIDs and α-Me-COOH drugs (“rotational barrier” hypothesis). In total 39 NSAIDs, including 15 α-Me-COOH launched drugs, were evaluated; ketorolac (as separate enantiomers) was on the list, and the racemic mixture was selected based on its approval for human use. See Figure G in S1 File for detailed heatmap that illustrates the less-than-perfect overlap of the two queries, R-naproxen and R-ketorolac due to the significant differences in their structures.
Fig 8
Fig 8. Ketorolac exhibits enantiomer selective inhibitory properties against Rac1 and Cdc42.
(A-B) GLISA effector binding assays were used to quantify Rac1 and Cdc42 GTPase activities in cell lysates (Swiss 3T3 cells) following 1 h preincubation with varying concentrations of R- and S-ketorolac with and without EGF stimulation. N = 3 or more trials. One-way ANOVA and Dunnett’s multiple comparison tests shows R-ketorolac samples and CID2950007 (Cdc42 inhibitor) significantly different (*p<0.05, **p<0.01, ***p<0.001) from EGF stimulated controls. (C-D) Flow cytometric G-trap effector binding assays were used to determine dose dependent inhibition by R-ketorolac vs. S-ketorolac in HeLa cells. R-ketorolac EC50 against Rac1 = 0.574 μM; R-ketorolac EC50 against Cdc42 = 1.07 μM. The inhibition curves were fitted to the sigmoidal dose-response equation in GraphPad Prism 5. Quantification of three independent measurements are plotted ± SEM.
Fig 9
Fig 9. Compound docking to Cdc42 based on DOCK9 magnesium exclusion model.
The docking model is based on the work of Yang et al., 2009 [77] wherein Val1951 in the sensing domain of the DOCK9 GEF (dark green ribbon) was suggested to reduce nucleotide interaction with Mg2+ via steric hinderance or ‘exclusion’ and thereby destabilize nucleotide binding to cause release from the GTPase active site. (A-B) The crystal structure of Cdc42-GDP in complex with the DOCK9 GEF (PDB ID 2WMN) was used to predict the active site docking of (C-D) 6-MNA, (E-F) R-, S-naproxen and (G-H) R-, S-ketorolac. (B, D, F, H) The carboxyl moiety in all compounds is proposed to interact with the Mg2+, thereby reducing interaction with GDP and reducing binding affinity analogous to Val1951 (teal). R-naproxen and R-ketorolac are shown in red. 6-MNA rust, S-naproxen and S-ketorolac are shown in green. R-enantiomers show more favorable interaction with Mg2+ than S-enantiomers due to rotational constraints imposed on the carboxylate by the stereocenter. For quantification of free energy of ligand binding and distances see Table G in S1 File.
Fig 10
Fig 10. Compound docking to Rac1.
NSAID docking on Rac1 was modeled on the ‘magnesium exclusion’ model proposed based on the crystal structure of Cdc42 complexed to DOCK9 GEF [77] and subsequently also validated for the crystal structure of Rac1 complexed to DOCK2 [78]. (A-B) The crystal structure of Rac1-GDP in complex with the DOCK9 GEF (PDB ID 2YIN) was used to predict the active site docking of 6-MNA, (C-D) R-, S-naproxen and (E-F) R-, S-ketorolac. The carboxyl moiety in all compounds is proposed to interact with the Mg2+, thereby reducing interaction with GDP and binding affinity analogous to Val1539 (teal) in the DOCK2 GEF (see Fig 9 for detail). R-naproxen and R-ketorolac are shown in red. 6-MNA rust, S-naproxen and S-ketorolac are shown in green. R-enantiomers show more favorable interaction with Mg2+ than S-enantiomers due to rotational constraints imposed on the carboxylate by the stereocenter. For quantification of free energy of ligand binding and distances see Table G in S1 File.

Similar articles

Cited by

References

    1. Hall A. Rho family GTPases. Biochem Soc Trans. 2012;40(6):1378–82. 10.1042/BST20120103 . - DOI - PubMed
    1. Heasman SJ, Ridley AJ. Mammalian Rho GTPases: new insights into their functions from in vivo studies. Nat Rev Mol Cell Biol. 2008;9(9):690–701. 10.1038/nrm2476 . - DOI - PubMed
    1. Karlsson R, Pedersen ED, Wang Z, Brakebusch C. Rho GTPase function in tumorigenesis. Biochim Biophys Acta. 2009;1796(2):91–8. 10.1016/j.bbcan.2009.03.003 . - DOI - PubMed
    1. Lawson CD, Burridge K. The on-off relationship of Rho and Rac during integrin-mediated adhesion and cell migration. Small GTPases. 2014;5 10.4161/sgtp.27958 . - DOI - PMC - PubMed
    1. Ridley AJ. Life at the leading edge. Cell. 2011;145(7):1012–22. 10.1016/j.cell.2011.06.010 . - DOI - PubMed

Publication types

MeSH terms