. 2016 Feb 5;37(4):437-47.
doi: 10.1002/jcc.24249. Epub 2015 Nov 12.

Attracting cavities for docking. Replacing the rough energy landscape of the protein by a smooth attracting landscape

Affiliations

Attracting cavities for docking. Replacing the rough energy landscape of the protein by a smooth attracting landscape

Vincent Zoete et al. J Comput Chem. .

Abstract

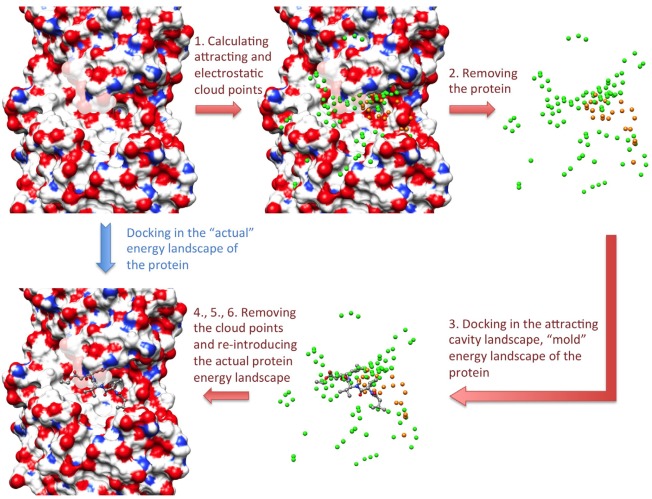
Molecular docking is a computational approach for predicting the most probable position of ligands in the binding sites of macromolecules and constitutes the cornerstone of structure-based computer-aided drug design. Here, we present a new algorithm called Attracting Cavities that allows molecular docking to be performed by simple energy minimizations only. The approach consists in transiently replacing the rough potential energy hypersurface of the protein by a smooth attracting potential driving the ligands into protein cavities. The actual protein energy landscape is reintroduced in a second step to refine the ligand position. The scoring function of Attracting Cavities is based on the CHARMM force field and the FACTS solvation model. The approach was tested on the 85 experimental ligand-protein structures included in the Astex diverse set and achieved a success rate of 80% in reproducing the experimental binding mode starting from a completely randomized ligand conformer. The algorithm thus compares favorably with current state-of-the-art docking programs.

Keywords: algorithm; docking; drug; drug design; protein; protein cavities; small molecule.


Figures

Figure 1
Figure 1
AC algorithm. The attracting and electrostatic cloud points are shown as green and orange spheres, respectively. The numbering of the arrows corresponds to the description of the algorithm given in the text.
Figure 2
Figure 2
Algorithm to determine the attracting cloud points. Brown crosses represent example grid points surrounded by their inner (brown) and outer (green) spheres of radius R in (3.2 Å) and R out, (8.0 Å) respectively. Protein atoms are shown as van der Waals spheres. A grid point is elected attracting point if the number of protein heavy atoms in the inner sphere (N in) is null, if the number of protein heavy atoms in the outer sphere is larger than N Thr, and if it is not closer than 1.5 Å from another attracting point. Large values of N Thr (70 and above) strictly concentrate attracting points in protein cavities, while smaller values (50 to 60) extend the distribution to less concave regions of the protein surface. Even smaller N Thr values allow covering the entire surface of the protein, including convex regions. [Color figure can be viewed in the online issue, which is available at wileyonlinelibrary.com.]
Figure 3
Figure 3
Distribution of attracting points on the surface of HSP90 (2BSM in the PDB), as a function of N Thr. Attracting points calculated using N Thr = 70, 60, and 50 are shown as orange, pink, and green spheres, respectively. The experimental position of the HSP90 ligand is shown in thick line to locate the binding pocket. N Thr = 70 concentrates the attracting points in the binding pocket, while N Thr = 50 extends the distribution to all protein invaginations. The distributions were calculated with R in = 3.2 Å and R out = 8.0 Å. [Color figure can be viewed in the online issue, which is available at wileyonlinelibrary.com.]
Figure 4
Figure 4
Comparison between the “actual” energy landscape of the protein and the attracting cavity landscape. A) Experimental structure of the Imatinib/c‐Kit complex (PDB44 ID 1T4665). C‐Kit is displayed as a beige ribbon and Imatinib in ball and stick representation. Green dots show the plane on which the “actual” or the attracting cavivity energy landscapes were calculated. (B) Log‐scale of the “actual” energy landscape of the protein. (C) Attracting cavity energy landscape, calculated as described in the Methods section for an aliphatic carbon atom with a charge of −0.09 e. The energy minimum corresponds to the center of the binding site. The attracting cavity energy landscape offers a smooth driving force for energy minimization, contrarily to the rough actual energy landscape. Heat maps were obtained using the gnuplot program (http://www.gnuplot.info).
Figure 5
Figure 5
Examples of docking success and failure. (A) Top: ligand conformation in the native binding mode (left) compared with the randomized conformation (right) for 1YWR66. The RMSD between the two conformations calculated on the heavy atoms after fitting is 3.7 Å. Bottom: comparison between the experimental binding mode (ball and stick) and the top‐ranked binding mode calculated with AC (cyan stick). The RMSD between the two binding modes is 1.0 Å, corresponding to a docking success. (B) Top: ligand conformation in the native binding mode (left) compared with the randomized conformation (right) for 1HVY67. The RMSD between the two conformations calculated on the heavy atoms after fitting is 3.2 Å. Bottom: comparison between the experimental binding mode (ball and stick) and the top‐ranked binding mode calculated with AC (cyan stick). The RMSD between the two binding modes is 2.8 Å, corresponding to a docking failure. [Color figure can be viewed in the online issue, which is available at wileyonlinelibrary.com.]

References

    1. Sousa S. F., Ribeiro A. J. M., Coimbra J. T. S., Neves R. P. P., Martins S. A., Moorthy N. S. H. N., Fernandes P. A., Ramos M. J., Curr. Med. Chem., 2013, 20, 2296. - PubMed
    1. Zoete V., Grosdidier A., Michielin O., J. Cell. Mol. Med. 2009, 13, 238 DOI:10.1111/j.1582-4934.2008.00665.x. - DOI - PMC - PubMed
    1. Grinter S. Z., Zou X., Molecules. 2014, 19, 10150 DOI:10.3390/molecules190710150. - DOI - PMC - PubMed
    1. Rarey M., Kramer B., Lengauer T., Klebe G., J. Mol. Biol. 1996, 261, 470 DOI:10.1006/jmbi.1996.0477. - DOI - PubMed
    1. Claussen H., Buning C., Rarey M., Lengauer T., J. Mol. Biol. 2001, 308, 377. DOI:10.1006/jmbi.2001.4551. - DOI - PubMed

Publication types