

Distinct cytokine/chemokine network in semen and blood characterize different stages of HIV infection
- PMID: 26558730
- PMCID: PMC4862605
- DOI: 10.1097/QAD.0000000000000964
Distinct cytokine/chemokine network in semen and blood characterize different stages of HIV infection
Abstract
Objective: The cytokine/chemokine network is used by the innate and adaptive immune system to orchestrate effective immune responses. Here, we describe the cross-sectional association between cytokine levels and stage of HIV infection to gain novel insights into HIV-1 immunopathogenesis and identify novel therapeutic targets.
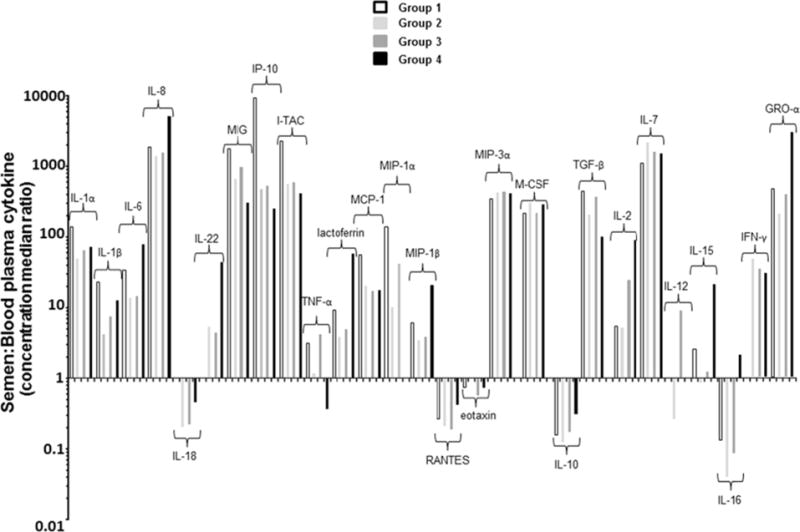
Design: Concentrations of 31 cytokine/chemokines were retrospectively measured in blood and seminal plasma collected from 252 individuals enrolled in four well characterized cohorts: HIV-uninfected, untreated HIV-infected in early phase of infection, untreated HIV-infected in late phase of infection, and HIV-infected on antiretroviral therapy with undetectable HIV RNA levels in blood (<50 copies/ml).
Methods: Cytokine/chemokine levels were measured by multiplex-bead array. Comparisons between groups were performed by Mann-Whitney U-test and P values were adjusted for multiple comparisons using the Benjamini-Hochberg method.
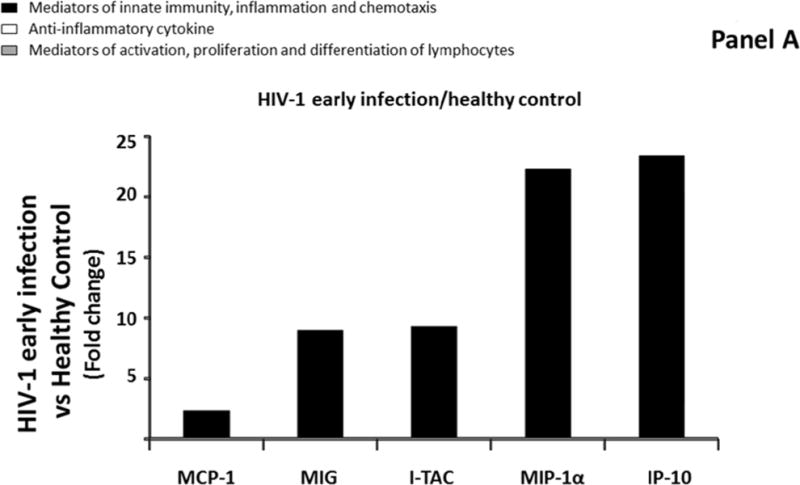
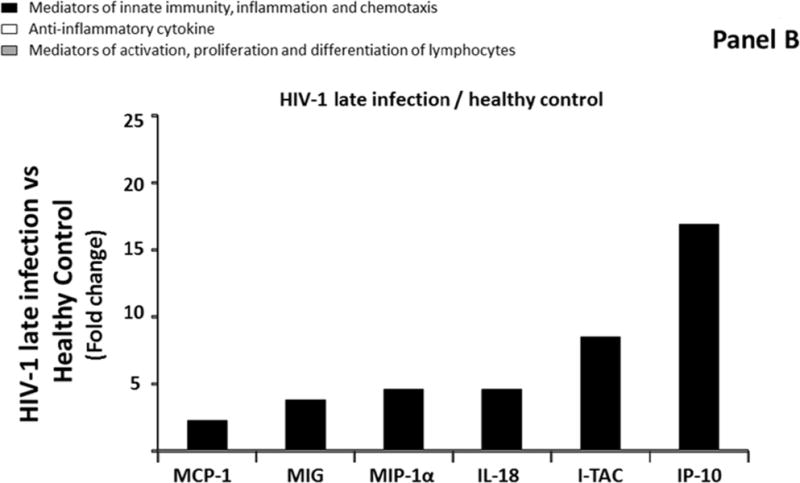
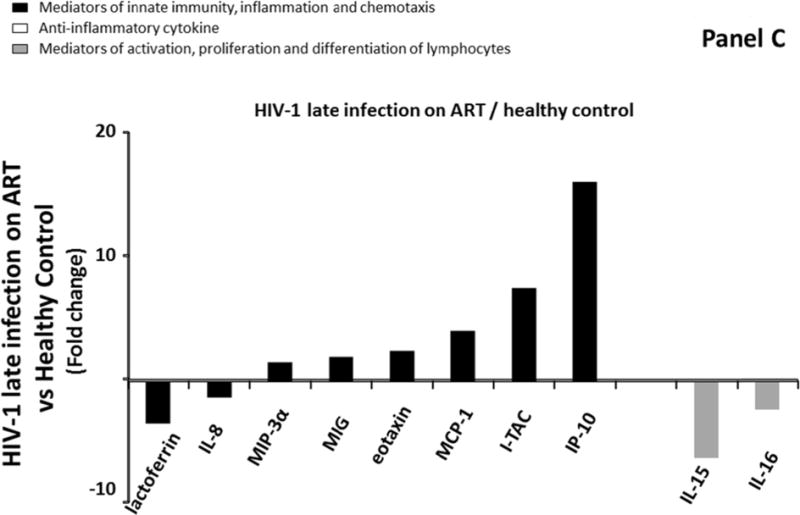
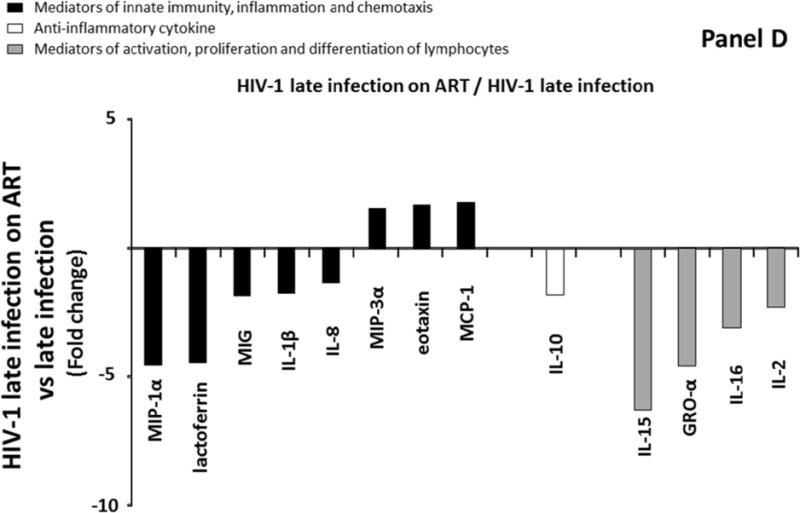
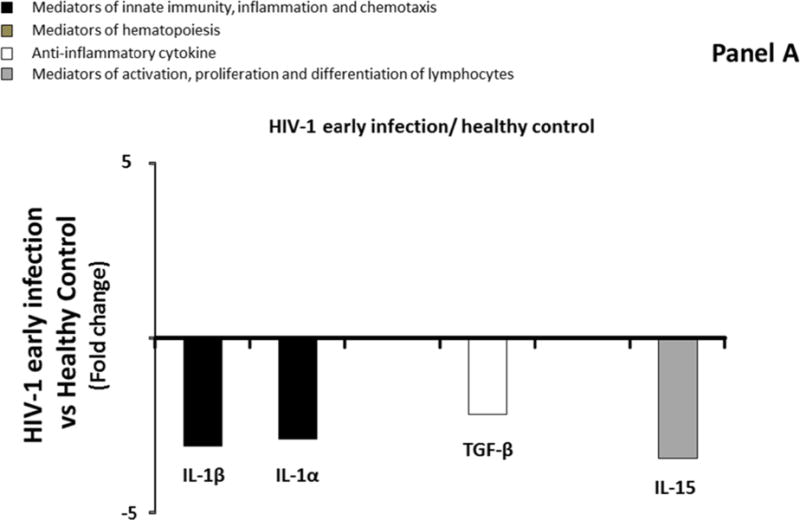
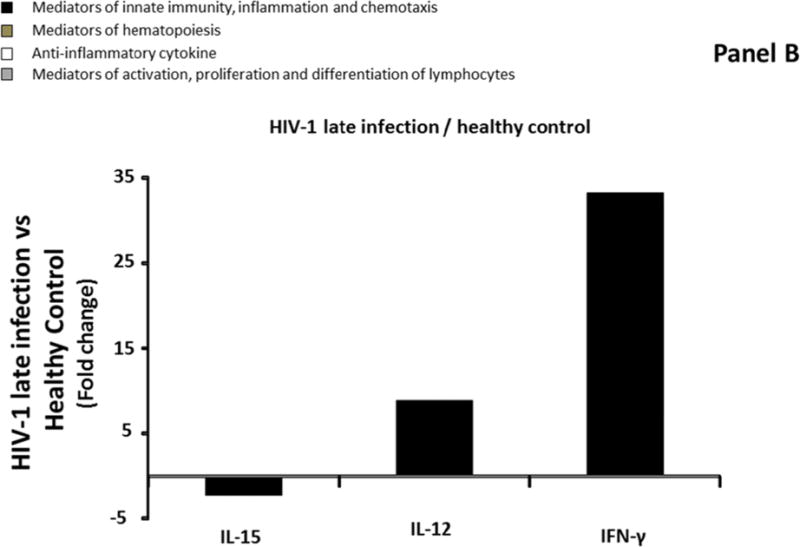
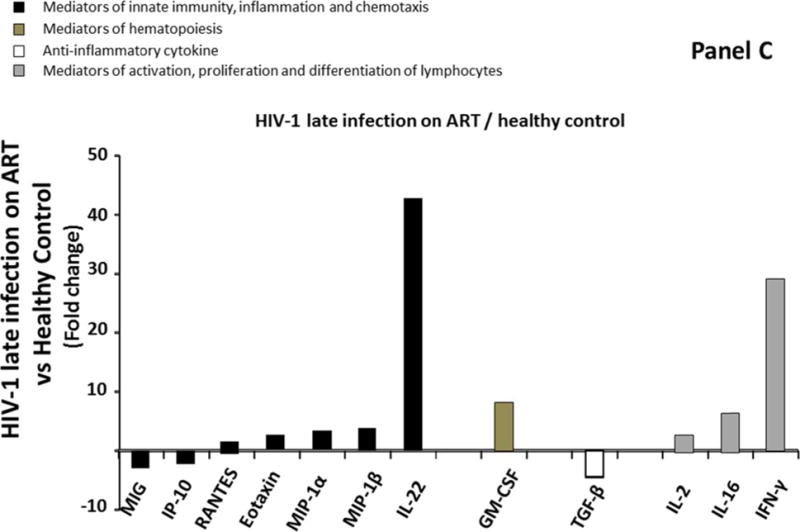
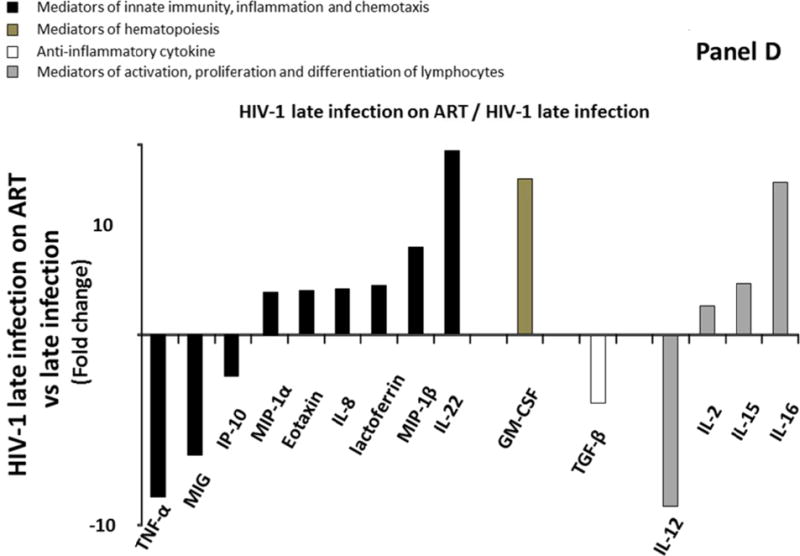
Results: Presence of HIV-infection skewed the cytokine/chemokine network towards a pro-inflammatory response in both blood and semen compared to HIV-uninfected controls. Such changes emerged within the first weeks of infection and were maintained thereafter: Among untreated HIV-infected individuals, none of the 31 measured cytokines were significantly different between early and later stages of infection. Suppression of plasma HIV RNA with ART did not result in normalization of the levels of pro-inflammatory cytokines in blood. In semen, several pro-inflammatory cytokines were even further upregulated in ART-treated compared with HIV-uninfected and HIV-untreated individuals.
Conclusion: A profound disruption in the cytokine/chemokine network is evident in blood and semen from the earliest stage of HIV infection shortly after the first detection of systemic viremia. These changes are maintained throughout the chronic phase of the infection and do not normalize despite ART and suppression of plasma HIV RNA.
Conflict of interest statement
CV, AI, SRM, LM, SJL, AL, LM, and SG do not have any commercial or other associations that might pose a conflict of interest. DMS has received grant support from ViiV Pharmaceuticals and consultant fees from Gen-Probe and Testing Talent Services. MPD has received grant support from Merck, Gilead, Serono, and ViiV and has served as a consultant to Serono. ESD has received grant support from Bristol Myers Squibb, Gilead, and ViiV, and has acted as a consultant for Abbvie, Bristol Myers Squibb, Gilead, Merck, Teva, and ViiV.
Figures
Similar articles
-
Endometrial epithelial cell response to semen from HIV-infected men during different stages of infection is distinct and can drive HIV-1-long terminal repeat.AIDS. 2012 Jan 2;26(1):27-36. doi: 10.1097/QAD.0b013e32834e57b2. AIDS. 2012. PMID: 22095191
-
Effect of HIV suppression on the cytokine network in blood and seminal plasma.AIDS. 2022 Apr 1;36(5):621-630. doi: 10.1097/QAD.0000000000003146. AIDS. 2022. PMID: 34873090 Free PMC article.
-
Semen of HIV-1-infected individuals: local shedding of herpesviruses and reprogrammed cytokine network.J Infect Dis. 2012 Jan 1;205(1):97-105. doi: 10.1093/infdis/jir700. Epub 2011 Nov 22. J Infect Dis. 2012. PMID: 22107749 Free PMC article.
-
Molecular biological assessment methods and understanding the course of the HIV infection.APMIS Suppl. 2003;(114):1-37. APMIS Suppl. 2003. PMID: 14626050 Review.
-
Prostaglandins in primate semen: biasing the immune system to benefit spermatozoa and virus?Prostaglandins Leukot Essent Fatty Acids. 1997 Aug;57(2):113-8. doi: 10.1016/s0952-3278(97)90000-4. Prostaglandins Leukot Essent Fatty Acids. 1997. PMID: 9250693 Review.
Cited by
-
Using the power of innate immunoprofiling to understand vaccine design, infection, and immunity.Hum Vaccin Immunother. 2023 Dec 15;19(3):2267295. doi: 10.1080/21645515.2023.2267295. Epub 2023 Oct 26. Hum Vaccin Immunother. 2023. PMID: 37885158 Free PMC article. Review.
-
Period of Boar Ejaculate Collection Contributes to the Yearly Intra-Male Variability of Seminal Plasma Cytokines.Biology (Basel). 2020 May 20;9(5):105. doi: 10.3390/biology9050105. Biology (Basel). 2020. PMID: 32443675 Free PMC article.
-
Cytokine cascade and networks among MSM HIV seroconverters: implications for early immunotherapy.Sci Rep. 2016 Nov 10;6:36234. doi: 10.1038/srep36234. Sci Rep. 2016. PMID: 27830756 Free PMC article.
-
A common anti-cytomegalovirus drug, ganciclovir, inhibits HIV-1 replication in human tissues ex vivo.AIDS. 2017 Jul 17;31(11):1519-1528. doi: 10.1097/QAD.0000000000001532. AIDS. 2017. PMID: 28657962 Free PMC article.
-
Penile Immune Activation and Risk of HIV Shedding: A Prospective Cohort Study.Clin Infect Dis. 2017 Mar 15;64(6):776-784. doi: 10.1093/cid/ciw847. Clin Infect Dis. 2017. PMID: 28011606 Free PMC article.
References
-
- Hunt PW. HIV and inflammation: mechanisms and consequences. Curr HIV/AIDS Rep. 2012;9:139–147. - PubMed
-
- Ipp H, Zemlin A. The paradox of the immune response in HIV infection: when inflammation becomes harmful. Clin Chim Acta. 2013;416:96–99. - PubMed
-
- Alfano M, Crotti A, Vicenzi E, Poli G. New players in cytokine control of HIV infection. Curr HIV/AIDS Rep. 2008;5:27–32. - PubMed
Publication types
MeSH terms
Substances
Grants and funding
- UL1TR000124/TR/NCATS NIH HHS/United States
- K24 AI100665/AI/NIAID NIH HHS/United States
- R24AI106039/AI/NIAID NIH HHS/United States
- R21 AI077304/AI/NIAID NIH HHS/United States
- R01 MH101012/MH/NIMH NIH HHS/United States
- 7-UM1 AI068636-07/AI/NIAID NIH HHS/United States
- AI043638/AI/NIAID NIH HHS/United States
- R01 AI047745/AI/NIAID NIH HHS/United States
- UM1 AI069432/AI/NIAID NIH HHS/United States
- AI080353/AI/NIAID NIH HHS/United States
- AI047745/AI/NIAID NIH HHS/United States
- AI36214/AI/NIAID NIH HHS/United States
- U01 AI027670/AI/NIAID NIH HHS/United States
- MH083552/MH/NIMH NIH HHS/United States
- UL1 TR000124/TR/NCATS NIH HHS/United States
- R21 AI047745/AI/NIAID NIH HHS/United States
- GM093939/GM/NIGMS NIH HHS/United States
- R01 GM093939/GM/NIGMS NIH HHS/United States
- U01 AI069432/AI/NIAID NIH HHS/United States
- AI74621/AI/NIAID NIH HHS/United States
- AI27670/AI/NIAID NIH HHS/United States
- AI306214/AI/NIAID NIH HHS/United States
- U01 AI043638/AI/NIAID NIH HHS/United States
- MH101012/MH/NIMH NIH HHS/United States
- R56 AI047745/AI/NIAID NIH HHS/United States
- P30 AI027763/AI/NIAID NIH HHS/United States
- P30 MH062512/MH/NIMH NIH HHS/United States
- R21 AI080353/AI/NIAID NIH HHS/United States
- MH62512/MH/NIMH NIH HHS/United States
- P30 AI036214/AI/NIAID NIH HHS/United States
- AI100665/AI/NIAID NIH HHS/United States
- R01 MH083552/MH/NIMH NIH HHS/United States
- UL1 TR000100/TR/NCATS NIH HHS/United States
- AI43638/AI/NIAID NIH HHS/United States
- AI077304/AI/NIAID NIH HHS/United States
- AI69432/AI/NIAID NIH HHS/United States
- P01 AI074621/AI/NIAID NIH HHS/United States
- UL1TR000100/TR/NCATS NIH HHS/United States
- P30-AI027763/AI/NIAID NIH HHS/United States
- UM1 AI068636/AI/NIAID NIH HHS/United States
- R24 AI106039/AI/NIAID NIH HHS/United States
LinkOut - more resources
Full Text Sources
Other Literature Sources
Medical
