. 2015 Nov 11;35(45):15026-38.
doi: 10.1523/JNEUROSCI.2484-15.2015.

Live Imaging of Calcium Dynamics during Axon Degeneration Reveals Two Functionally Distinct Phases of Calcium Influx

Affiliations

Live Imaging of Calcium Dynamics during Axon Degeneration Reveals Two Functionally Distinct Phases of Calcium Influx

Mauricio Enrique Vargas et al. J Neurosci. .

Abstract

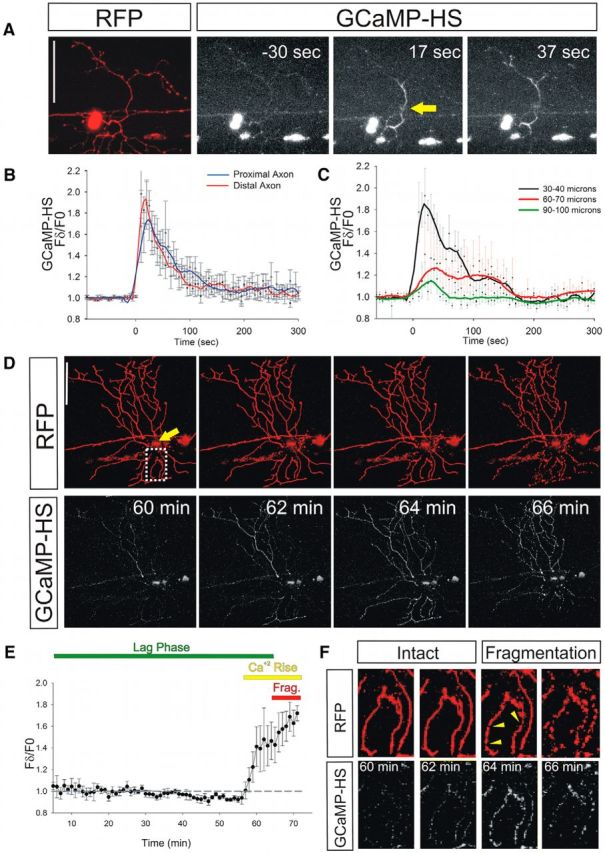
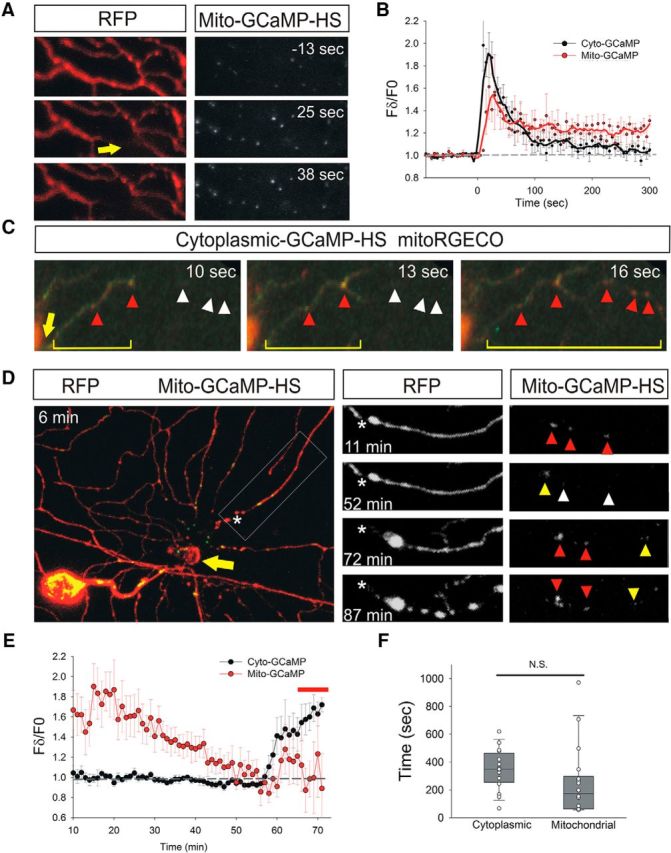
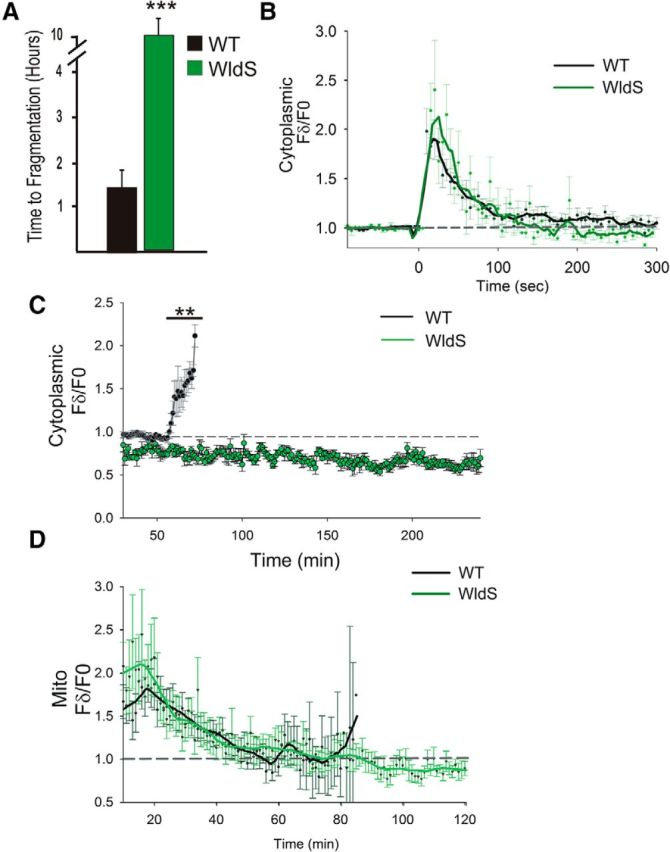
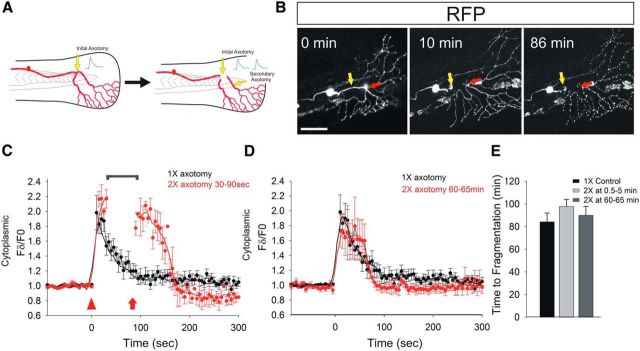
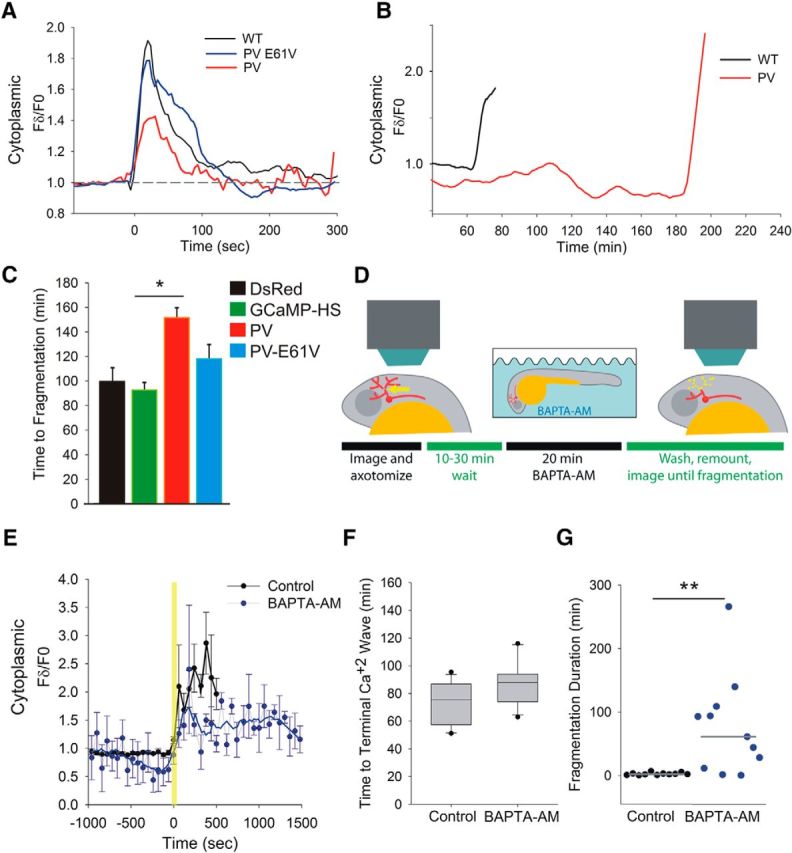
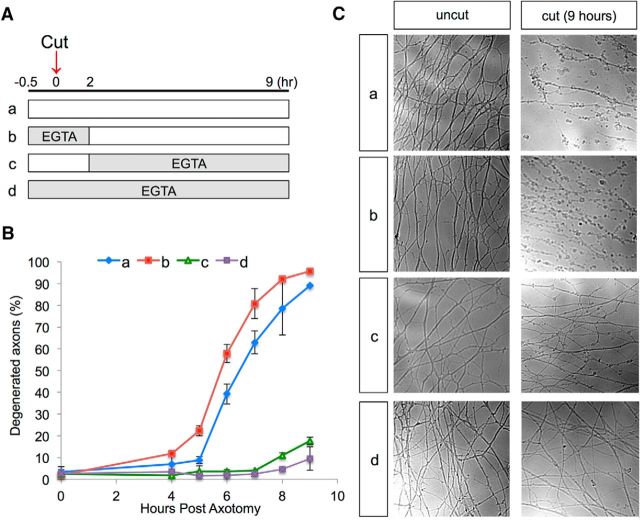
Calcium is a key regulator of axon degeneration caused by trauma and disease, but its specific spatial and temporal dynamics in injured axons remain unclear. To clarify the function of calcium in axon degeneration, we observed calcium dynamics in single injured neurons in live zebrafish larvae and tested the temporal requirement for calcium in zebrafish neurons and cultured mouse DRG neurons. Using laser axotomy to induce Wallerian degeneration (WD) in zebrafish peripheral sensory axons, we monitored calcium dynamics from injury to fragmentation, revealing two stereotyped phases of axonal calcium influx. First, axotomy triggered a transient local calcium wave originating at the injury site. This initial calcium wave only disrupted mitochondria near the injury site and was not altered by expression of the protective WD slow (WldS) protein. Inducing multiple waves with additional axotomies did not change the kinetics of degeneration. In contrast, a second phase of calcium influx occurring minutes before fragmentation spread as a wave throughout the axon, entered mitochondria, and was abolished by WldS expression. In live zebrafish, chelating calcium after the first wave, but before the second wave, delayed the progress of fragmentation. In cultured DRG neurons, chelating calcium early in the process of WD did not alter degeneration, but chelating calcium late in WD delayed fragmentation. We propose that a terminal calcium wave is a key instructive component of the axon degeneration program.

Significance statement: Axon degeneration resulting from trauma or neurodegenerative disease can cause devastating deficits in neural function. Understanding the molecular and cellular events that execute axon degeneration is essential for developing treatments to address these conditions. Calcium is known to contribute to axon degeneration, but its temporal requirements in this process have been unclear. Live calcium imaging in severed zebrafish neurons and temporally controlled pharmacological treatments in both zebrafish and cultured mouse sensory neurons revealed that axonal calcium influx late in the degeneration process regulates axon fragmentation. These findings suggest that temporal considerations will be crucial for developing treatments for diseases associated with axon degeneration.

Keywords: Wallerian degeneration; WldS; axon; calcium; mitochondria; zebrafish.


Figures

Figure 1.
Figure 1.
Cytoplasmic calcium rises immediately after axotomy and immediately before axon fragmentation. A, RB neuron in a 2 dpf zebrafish larva expressing DsRed (left) and GCaMP-HS (3 right) before (−30 s) and after (17 and 37 s) laser axotomy. GCaMP-HS fluorescence traveled as a wave away from the axotomy site toward both the cell body and into the axon fragment. Arrow points to the axotomy site. Scale bar, 100 μm. B, Plot of relative GCaMP-HS fluorescence intensity changes in regions 50 μm distal and proximal to the axotomy site (n = 12). The GCaMP-HS fluorescence waves were similar in distal and proximal directions. C, Plot of relative GCaMP-HS fluorescence intensity changes at several distances from the axotomy site in the distal axon fragment (n = 12). The GCaMP-HS fluorescence waves diminished in magnitude with distance from the axotomy site. The average velocity of GCaMP-HS fluorescence waves was 2.66 μm/s, measured as time to fluorescence peak. D, RB neuron in a 2 dpf zebrafish larva expressing DsRed and GCaMP-HS. Times after axotomy are indicated in minutes. GCaMP-HS fluorescence rose minutes (62–64 min) before fragmentation (64–66 min). Arrow points to the axotomy site. Scale bar, 100 μm. E, Plot of GCaMP-HS fluorescence intensity changes throughout the lag phase, starting 5 min after axotomy, measured in 1 min intervals (n = 4 neurons in 4 fish). GCaMP-HS fluorescence rose minutes before fragmentation. Frag, Fragmentation. F, Magnification of a separated branch of the axon shown in D; magnified area corresponds to the dotted box. Note that calcium increased between 60 and 62 min after axotomy, but signs of fragmentation (arrowheads) were not apparent until 64 min after axotomy.
Figure 2.
Figure 2.
Mitochondrial calcium increases after cytoplasmic calcium influx induced by axotomy and just before fragmentation. A, Peripheral axon arbor of an RB neuron in a 2 dpf zebrafish larva expressing DsRed and Mito-GCaMP-HS before (−13 s) and after (25 and 38 s) laser axotomy. Mito-GCaMP-HS fluorescence intensity rose in mitochondria near axotomy site (arrow). B, Plot comparing relative fluorescence intensity changes in GCaMP-HS and Mito-GCaMP-HS in regions 50 μm distal to the axotomy site (n = 9 neurons for GCaMP-HS and 12 neurons for Mito-GCaMP-HS). The Mito-GCaMP-HS fluorescence rose with similar kinetics in the cytoplasm and mitochondria, but remained elevated for longer in axonal mitochondria. C, Spatial comparison of calcium rises in cytoplasm (GCaMP-HS, green) and mitochondria (mitoRGECO, red) after axotomy (indicated in seconds). Arrow points to site of axotomy, bracket indicates extent of cytoplasmic calcium wave, red arrowheads indicate mitochondria with elevated calcium, and white arrowheads indicate locations of mitochondria with baseline calcium. Note that mitochondrial calcium increases followed cytoplasmic calcium increases. D, RB neuron in a 2 dpf zebrafish larva expressing RFP and Mito-GCaMP-HS after axotomy. Times after axotomy indicated in minutes. Arrow indicates axotomy site. Area boxed in left panel is magnified in the right panels. Asterisk indicates proximal end of the severed axon branch. Arrowheads point to mitochondria in the magnified panels: red arrowheads indicate mitochondria with high GCaMP fluorescence, yellow indicates intermediate fluorescence, and white indicates low fluorescence. Note that calcium diminished between 11 and 52 min after axotomy, just before fragmentation. Fragmentation has just begun at the 72 h time-point in this axon. E, Plot comparing relative fluorescence intensity changes in GCaMP-HS and Mito-GCaMP-HS in regions 50 μm distal to the axotomy site, starting 10 min after axotomy, measured in 1 min intervals (n = 8 cytoplasmic measurements and 16 mitochondrial measurements). Note that Mito-GCaMP-HS fluorescence intensity diminished gradually through the lag phase, but increased minutes before fragmentation. Bar above graph indicates approximate time of fragmentation. F, Box plot showing duration of terminal calcium rise in cytoplasm and mitochondria starting when a calcium increase was first detected and ending when fragmentation was first detected (n = 16–18). Imaging intervals were 22–62 s for mitochondria and 29–135 s for cytoplasmic measurements. N.S., Not significant.
Figure 3.
Figure 3.
WldS suppresses the terminal, but not the initial, phase of cytoplasmic and mitochondrial calcium influx. A, Graph showing time to fragmentation of severed axons in wild-type (WT) and WldS-expressing neurons. No WldS-expressing axons fragmented within 10 h after axotomy (n = 10 WT and 24 WldS-expressing neurons). Experiments for both WT and WldS-expressing neurons were performed in stable transgenic lines expressing the fluorescent protein KikGR, as described previously (Martin et al., 2010). ***p < 0.005. B, Plot of relative GCaMP-HS fluorescence intensity changes in regions 50 μm distal to the axotomy site in WT and WldS-expressing neurons (n = 12 WT and 17 WldS neurons). GCaMP-HS fluorescence waves were similar in the two conditions. C, Plot showing GCaMP-HS fluorescence intensity changes in WT and WldS-expressing neurons over a 4 h period, starting at 30 min, imaged in 1 min intervals (n = 4 WT and 4 WldS neurons). Note that none of the axons in WLdS-expressing cells fragmented nor exhibited a calcium increase during the imaging period. **p < 0.01. D, Plot comparing relative fluorescence intensity changes in Mito-GCaMP-HS in regions 50 μm distal to the axotomy site of WT and WldS-expressing neurons, starting 10 min after axotomy, measured in 1 min intervals (n = 17 WT and 10 WldS-expressing neurons). There was no statistical difference in the peaks of fluorescence intensity between the two conditions. Note that Mito-GCaMP-HS fluorescence intensity diminished gradually through the lag phase in both conditions, but increased in WT just before fragmentation. Upon returning to baseline (∼60 min after axotomy) Mito-GCaMP-HS fluorescence remained close to baseline in WldS-expressing neurons.
Figure 4.
Figure 4.
Multiple axotomies induce additional calcium influx, but do not affect the timing of axon fragmentation. A, Diagram illustrating double axotomy experiment. B, Representative RB neuron in a 2 dpf animal expressing DsRed, shown before (0 min) and after (10 and 86 min) axotomy. Yellow arrow indicates site of first axotomy, red arrow indicates site of second axotomy. Axotomy sites were 50 μm apart. Often, the region between the two axotomy sites immediately degenerated, as in this example, but it is not clear whether this was due to tissue damage or acute axonal degeneration. Note that fragmentation of distal regions cut twice occurred with similar kinetics to regions cut once. Scale bar, 100 μm. C, Plot comparing relative GCaMP-HS fluorescence intensity changes in regions 50 μm distal to the axotomy site in axons cut once (black) or twice within 90 s (red) (n = 12 for single cut, 4 for double cut). Arrowhead indicates start of fluorescence intensity changes after the first cut in a double-cut axon; arrow indicates fluorescence intensity changes after the second cut in a double-cut axon. Bracket indicates interval when imaging was interrupted to perform the second axotomy. Note that the second cut caused calcium levels to stay high for longer than in single-cut axons. D, Plot comparing relative GCaMP-HS fluorescence intensity changes in regions 50 μm distal to the axotomy site in axons cut once (black, same as in C) or after the second cut of an axon cut twice ∼1 h apart (red) (n = 12 for single cut, 4 for double cut). E, Graph showing time to fragmentation of axons severed once or twice (n = 15 for single cut, 10 for 0.5–5 min second cuts, and 6 for 60–65 min second cuts). Note that additional axotomies did not alter the time to fragmentation.
Figure 5.
Figure 5.
In vivo calcium buffering specifically in neurons or after the first wave of calcium influx alters degeneration kinetics. A, Representative plots of GCaMP-HS fluorescence intensity changes in regions 50 μm distal to the axotomy site in WT, parvalbumin (PV)-expressing neurons and PV(E61V)-expressing neurons. Note that PV reduced the initial calcium wave, but PV(E61V) did not. B, Representative plots of GCaMP-HS fluorescence intensity changes in regions 50 μm distal to the axotomy site in WT and PV-expressing neurons, starting at 37 min, imaged at 1 min intervals. Traces end when the axons fragmented. Note that PV prolonged the lag phase. Similar results were observed in four PV-expressing axons. C, Graph showing time to fragmentation of severed axons in control (DsRed- and GCaMP-HS-expressing neurons), PV-expressing neurons, and PV(E61V)-expressing neurons [n = 12 DsRed-expressing neurons, 7 GCaMP-HS-expressing neurons, 23 PV-expressing neurons, and 16 PV(E61V)-expressing neurons]. *p < 0.05. D, Diagram illustrating the protocol for BAPTA-AM experiments. E, Plot of GCaMP-HS fluorescence intensity changes during the terminal calcium wave in control and BAPTA-AM-treated zebrafish, aligned to the time that a calcium rise was first detected. Traces end when axons fragmented. In BAPTA-AM-treated animals, the calcium rise was blunted and the duration of the fragmentation process was prolonged (n = 16 control and 9 BAPTA-AM-treated animals). Also note that calcium levels in BAPTA-AM-treated animals dipped just before they increased. By a Mann–Whitney U test, one time point (−4 min) was significantly different between BAPTA-AM-treated and control traces (p = 0.0321), but differences were not significant at the other time points. F, Plot of time to terminal fragmentation in control and BAPTA-AM-treated animals. BAPTA-AM did not significantly alter the time to calcium increase (n = 16 control and 11 BAPTA-AM-treated animals). G, Plot of time to completion of fragmentation in control and BAPTA-AM-treated animals (n = 11 control and 11 BAPTA-AM-treated animals). **p < 0.01.
Figure 6.
Figure 6.
Chelating calcium late in WD delays axon fragmentation in cultured mouse DRG neurons. A, Experimental design. Shaded areas indicate the period of treatment with 5 mm EGTA. B, Quantification of axon degeneration at the indicated time points after axotomy (see A for legend). Error bars indicate SD (n = 3). C, Representative phase contrast images of uncut and cut DRG axons at 9 h after axotomy. Each condition is labeled as in A.

References

    1. Adalbert R, Gillingwater TH, Haley JE, Bridge K, Beirowski B, Berek L, Wagner D, Grumme D, Thomson D, Celik A, Addicks K, Ribchester RR, Coleman MP. A rat model of slow Wallerian degeneration (WldS) with improved preservation of neuromuscular synapses. Eur J Neurosci. 2005;21:271–277. doi: 10.1111/j.1460-9568.2004.03833.x. - DOI - PubMed
    1. Adalbert R, Morreale G, Paizs M, Conforti L, Walker SA, Roderick HL, Bootman MD, Siklós L, Coleman MP. Intra-axonal calcium changes after axotomy in wild-type and slow Wallerian degeneration axons. Neuroscience. 2012;225:44–54. doi: 10.1016/j.neuroscience.2012.08.056. - DOI - PubMed
    1. Araki T, Sasaki Y, Milbrandt J. Increased nuclear NAD biosynthesis and SIRT1 activation prevent axonal degeneration. Science. 2004;305:1010–1013. doi: 10.1126/science.1098014. - DOI - PubMed
    1. Avery MA, Sheehan AE, Kerr KS, Wang J, Freeman MR. Wld S requires Nmnat1 enzymatic activity and N16-VCP interactions to suppress Wallerian degeneration. J Cell Biol. 2009;184:501–513. doi: 10.1083/jcb.200808042. - DOI - PMC - PubMed
    1. Avery MA, Rooney TM, Pandya JD, Wishart TM, Gillingwater TH, Geddes JW, Sullivan PG, Freeman MR. WldS prevents axon degeneration through increased mitochondrial flux and enhanced mitochondrial Ca2+ buffering. Curr Biol. 2012;22:596–600. - PMC - PubMed

Publication types