. 2015 Nov 11:12:93.
doi: 10.1186/s12977-015-0212-2.

Well-mixed plasma and tissue viral populations in RT-SHIV-infected macaques implies a lack of viral replication in the tissues during antiretroviral therapy

Affiliations

Well-mixed plasma and tissue viral populations in RT-SHIV-infected macaques implies a lack of viral replication in the tissues during antiretroviral therapy

Mary F Kearney et al. Retrovirology. .

Abstract

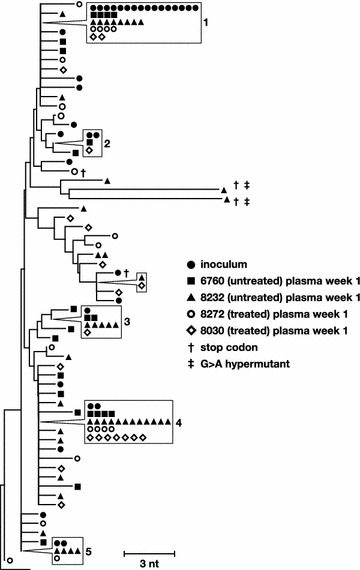
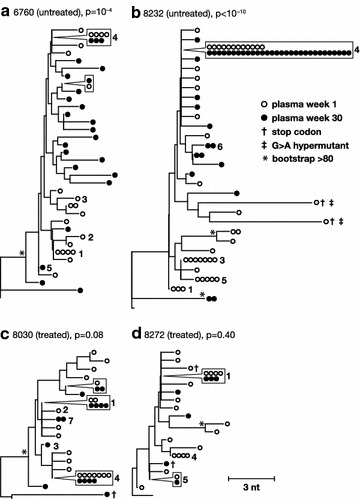
Background: Determining the anatomic compartments that contribute to plasma HIV-1 is critical to understanding the sources of residual viremia during combination antiretroviral therapy (ART). We analyzed viral DNA and RNA populations in the plasma and tissues from macaques infected with SIV containing HIV-1 RT (RT-SHIV) to identify possible sources of persistent viremia and to investigate the effect of ART on viral replication in tissues. Tissues were collected at necropsy from four pigtailed macaques infected for 30 weeks with a diverse population of RT-SHIV. Two animals (6760 and 8232) were untreated and two animals (8030 and 8272) were treated with efavirenz, tenofovir, and emtricitabine for 20 weeks.

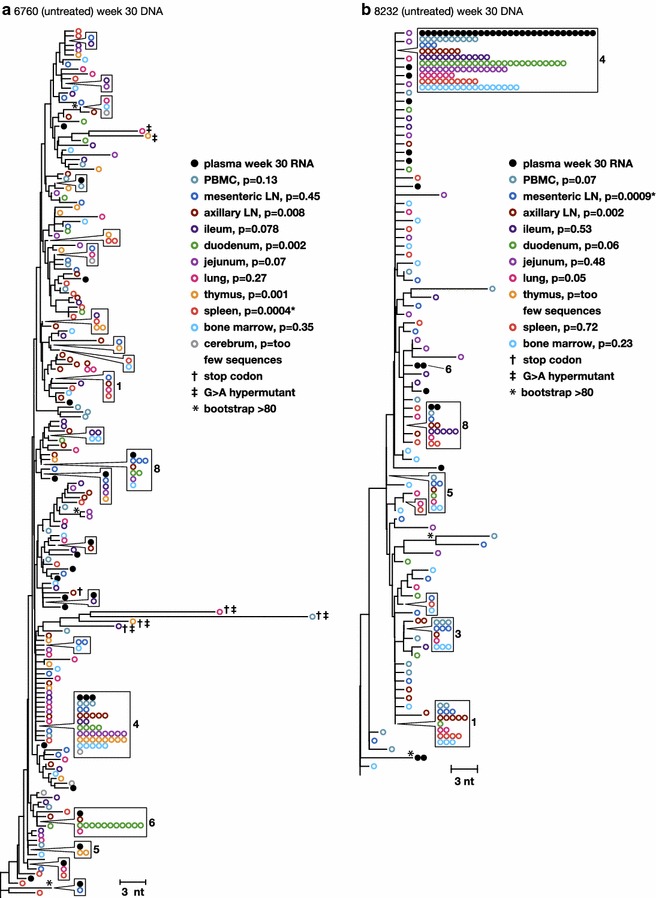
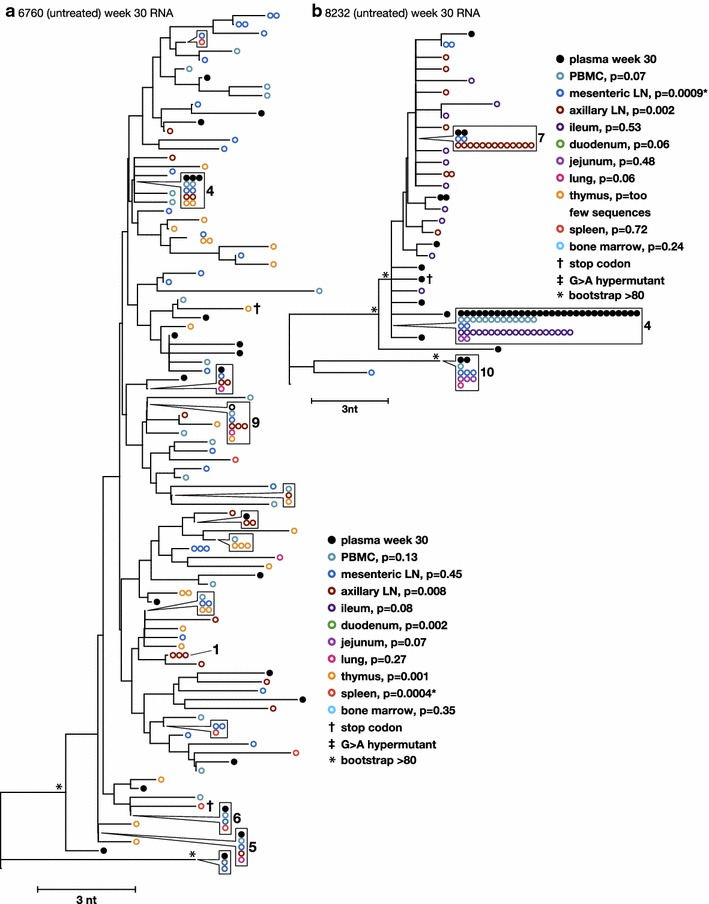
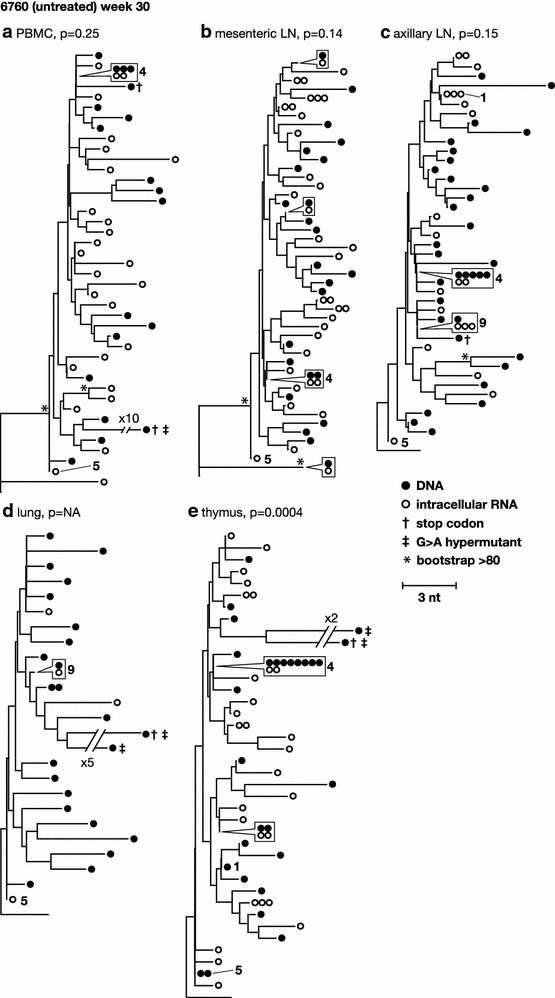
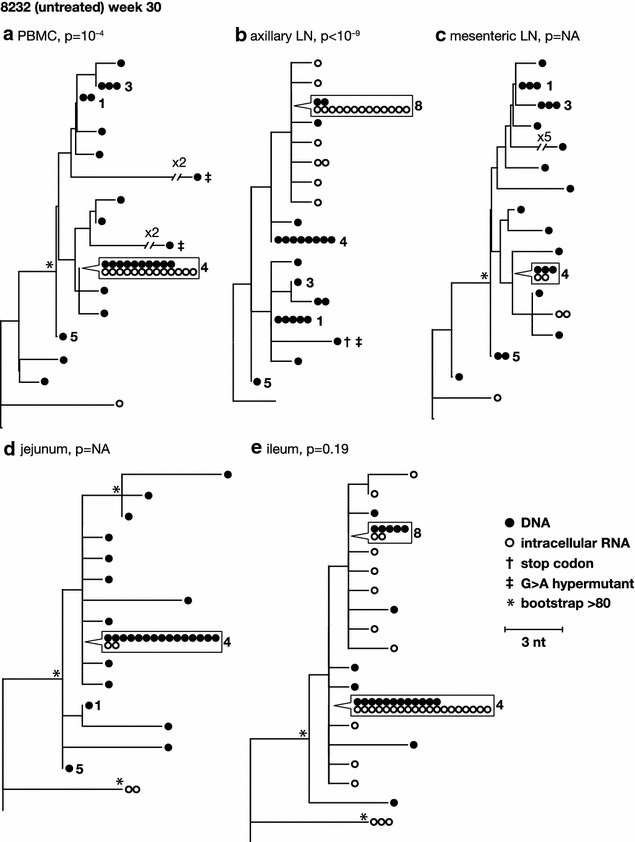
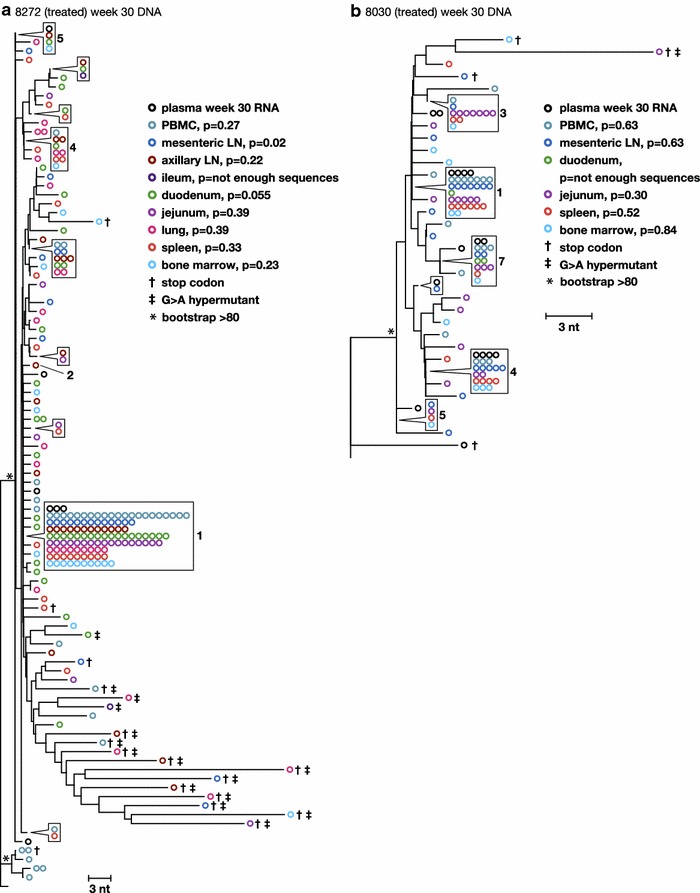
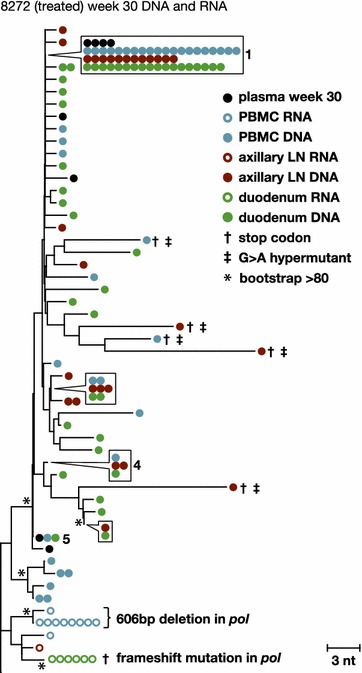
Results: A total of 1800 single-genome RT-SHIV pol and env DNA and RNA sequences were analyzed from the plasma, PBMCs, axillary and mesenteric lymph nodes, spleen, thymus, small intestine, bone marrow, lung, and brain. Analyses of intracellular DNA and RNA populations revealed that the majority of proviruses in tissues from untreated animal 8232 were not expressed, whereas a greater proportion of proviruses in tissues were expressed from 6760. Few intracellular RNA sequences were detected in treated animals and most contained inactivating mutations, such as frame shifts or large deletions. Phylogenetics showed that RT-SHIV DNA populations in tissues were not different from virus in contemporary plasma samples in the treated or untreated animals, demonstrating a lack of anatomic compartmentalization and suggesting that plasma viremia is derived from multiple tissue sources. No sequence divergence was detected in the plasma or between tissues in the treated animals after 20 weeks of ART indicating a lack of ongoing replication in tissues during treatment.

Conclusions: Virus populations in plasma and tissues did not differ significantly in either treated or untreated macaques, suggesting frequent exchange of virus or infected cells between tissues and plasma, consistent with non-compartmentalized and widely disseminated infection. There was no genetic evidence of ongoing replication in tissues during suppressive ART.


Figures

Fig. 1
Fig. 1
Phylogenetic relationships between single-genome sequences obtained from the challenge virus stock and from the plasma collected at one week post-infection from each animal. G to A hypermutants are marked by crosses. Numbers refer to clusters of sequences observed more than once here and in subsequent figures. Symbols shown in boxes indicate identical sequences that are present on the tree at the location indicated by the pointer
Fig. 2
Fig. 2
Phylogenetic and panmixia relationships between single-genome plasma sequences obtained one week and 30 weeks post-infection from each animal. Neighbor-joining trees were prepared using consensus B as an out group (bottom, unlabeled branch) for the untreated (a, b) and treated (c, d) animals. The p values shown next to each animal identifier denote the probability that the virus populations sampled at one week and 30 weeks after infection are not different (panmixia). Numbers refer to clusters of sequences observed more than once here and in previous and subsequent figures. Symbols shown in boxes indicate identical sequences that are present on the tree at the location indicated by the pointer. G to A hypermutants are marked by crosses. Asterisks indicate bootstrap values >80
Fig. 3
Fig. 3
Phylogenetic relationships between single-genome proviral sequences obtained from various anatomical compartments 30 weeks post-infection from the untreated animals a 6760 and b 8232. The panmixia probabilities comparing virus populations in the tissues (open colored circles) with sequences in the plasma (solid black circles) are shown next to each tissue in the key. G to A hypermutants are marked by crosses. Numbers refer to clusters of sequences observed more than once here and in previous and subsequent figures. Symbols shown in boxes indicate identical sequences that are present on the tree at the location indicated by the pointer
Fig. 4
Fig. 4
Phylogenetic relationships between intracellular RNA single-genome sequences obtained from different anatomical compartments 30 weeks post-infection from untreated animals 6760 and 8232. Numbers refer to clusters of sequences observed more than once here and in previous and subsequent figures. Symbols shown in boxes indicate identical sequences that are present on the tree at the location indicated by the pointer
Fig. 5
Fig. 5
Phylogenetic relationships between intracellular RNA and DNA single-genome sequences obtained from the same anatomical compartments 30 weeks post-infection from untreated animal 6760. p values for panmixia are shown where more than 7 sequences were obtained for both RNA and DNA. Numbers refer to clusters of sequences observed more than once here and in previous and subsequent figures. Symbols shown in boxes indicate identical sequences that are present on the tree at the location indicated by the pointer
Fig. 6
Fig. 6
Phylogenetic relationships between intracellular RNA and DNA single-genome sequences obtained from the same anatomical compartments 30 weeks post-infection from untreated animal 8232. p values for panmixia are shown where more than 7 sequences were obtained for both RNA and DNA. Numbers refer to clusters of sequences observed more than once here and in previous and subsequent figures. Symbols shown in boxes indicate identical sequences that are present on the tree at the location indicated by the pointer
Fig. 7
Fig. 7
Phylogenetic relationships between single-genome proviral sequences obtained from various anatomical compartments after 20 weeks of combination ART from animals a 8272 and b 8030. The panmixia probabilities comparing virus populations in the tissues (open colored circles) with sequences in the plasma (open black circles) are shown next to each tissue in the key. G to A hypermutants are marked by crosses. Numbers refer to clusters of sequences observed more than once here and in previous and subsequent figures. Symbols shown in boxes indicate identical sequences that are present on the tree at the location indicated by the pointer. Asterisks indicate bootstrap values >80
Fig. 8
Fig. 8
Phylogenetic relationships between intracellular RNA and DNA single-genome sequences obtained from the same anatomical compartments after 20 weeks of combination ART from animal 8272. p values for panmixia are shown where more than 7 sequences were obtained for both RNA and DNA. Numbers refer to clusters of sequences observed more than once here and in previous and subsequent figures. Symbols shown in boxes indicate identical sequences that are present on the tree at the location indicated by the pointer

Similar articles

Cited by

References

    1. Shiu C, Cunningham CK, Greenough T, Muresan P, Sanchez-Merino V, Carey V, Jackson JB, Ziemniak C, Belzer M, Ray SC, Luzuriaga K, Persaud D, Pediatric AIDS Clinical Trials Group P1059 Team Identification of ongoing HIV-1 replication in residual viremia during recombinant HIV-1 poxvirus immunizations in patients with clinically undetectable viral loads on durable suppressive HAART. J Virol. 2009;83:9731–9742. doi: 10.1128/JVI.00570-09. - DOI - PMC - PubMed
    1. Chun TW, Nickle DC, Justement JS, Meyers JH, Roby G, Hallahan CW, Kottilil S, Moir S, Mican JM, Mullins JI, et al. Persistence of HIV in gut-associated lymphoid tissue despite long-term antiretroviral therapy. J Infect Dis. 2008;197:714–720. doi: 10.1086/527324. - DOI - PubMed
    1. Gunthard HF, Wong JK, Ignacio CC, Guatelli JC, Riggs NL, Havlir DV, Richman DD. Human immunodeficiency virus replication and genotypic resistance in blood and lymph nodes after a year of potent antiretroviral therapy. J Virol. 1998;72:2422–2428. - PMC - PubMed
    1. Benito JM, Lopez M, Lozano S, Martinez P, Gonzalez-Lahoz J, Soriano V. CD38 expression on CD8 T lymphocytes as a marker of residual virus replication in chronically HIV-infected patients receiving antiretroviral therapy. AIDS Res Hum Retroviruses. 2004;20:227–233. doi: 10.1089/088922204773004950. - DOI - PubMed
    1. Cohen Stuart JW, Hazebergh MD, Hamann D, Otto SA, Borleffs JC, Miedema F, Boucher CA, de Boer RJ. The dominant source of CD4+ and CD8+ T-cell activation in HIV infection is antigenic stimulation. J Acquir Immune Defic Syndr. 2000;25:203–211. doi: 10.1097/00126334-200011010-00001. - DOI - PubMed

Publication types

MeSH terms