. 2015 Nov 6;12(112):20150843.
doi: 10.1098/rsif.2015.0843.

Quantification of plaque stiffness by Brillouin microscopy in experimental thin cap fibroatheroma

Affiliations

Quantification of plaque stiffness by Brillouin microscopy in experimental thin cap fibroatheroma

Giuseppe Antonacci et al. J R Soc Interface. .

Abstract

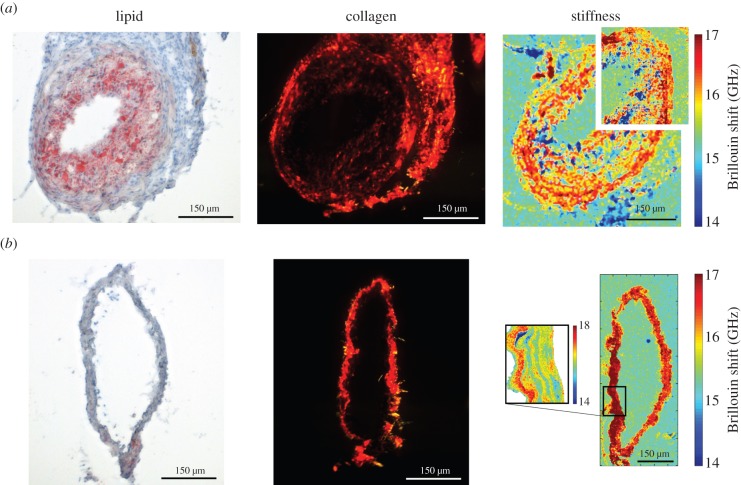
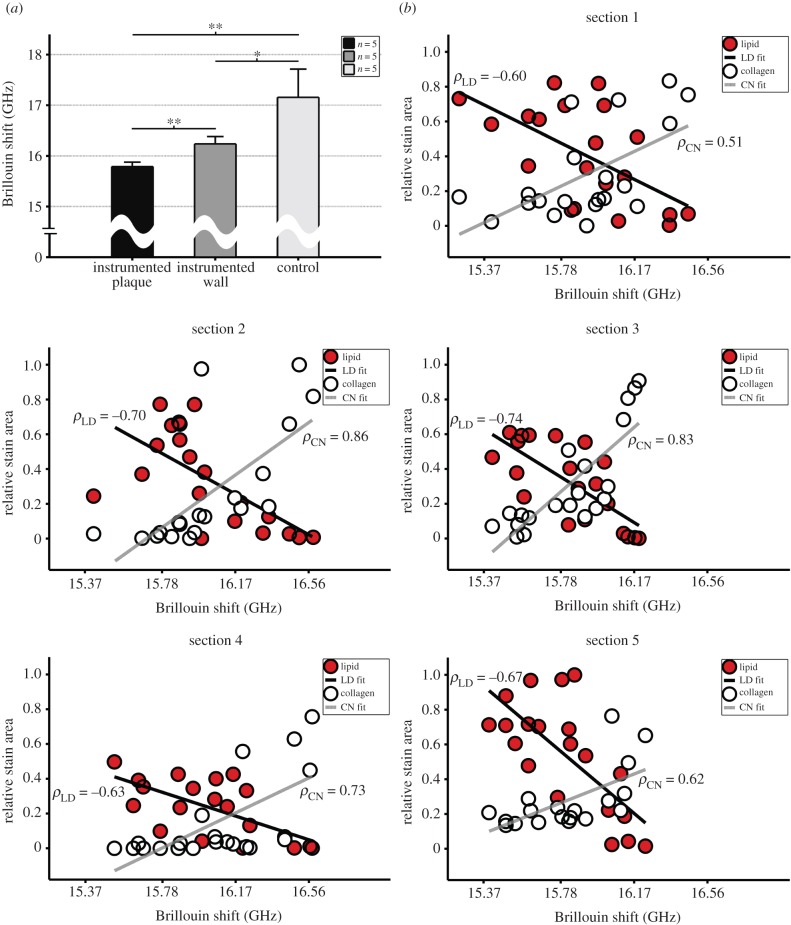
Plaques vulnerable to rupture are characterized by a thin and stiff fibrous cap overlaying a soft lipid-rich necrotic core. The ability to measure local plaque stiffness directly to quantify plaque stress and predict rupture potential would be very attractive, but no current technology does so. This study seeks to validate the use of Brillouin microscopy to measure the Brillouin frequency shift, which is related to stiffness, within vulnerable plaques. The left carotid artery of an ApoE(-/-)mouse was instrumented with a cuff that induced vulnerable plaque development in nine weeks. Adjacent histological sections from the instrumented and control arteries were stained for either lipids or collagen content, or imaged with confocal Brillouin microscopy. Mean Brillouin frequency shift was 15.79 ± 0.09 GHz in the plaque compared with 16.24 ± 0.15 (p < 0.002) and 17.16 ± 0.56 GHz (p < 0.002) in the media of the diseased and control vessel sections, respectively. In addition, frequency shift exhibited a strong inverse correlation with lipid area of -0.67 ± 0.06 (p < 0.01) and strong direct correlation with collagen area of 0.71 ± 0.15 (p < 0.05). This is the first study, to the best of our knowledge, to apply Brillouin spectroscopy to quantify atherosclerotic plaque stiffness, which motivates combining this technology with intravascular imaging to improve detection of vulnerable plaques in patients.

Keywords: atherosclerosis; biomechanics; plaque rupture.


Figures

Figure 1.
Figure 1.
Images of (left) lipid (imaged with light microscopy), (centre) collagen (imaged with polarized light microscopy) and (right) Brillouin shift (imaged with Brillouin microscopy), which is related to stiffness, obtained from representative neighbouring sections of the (a) instrumented and (b) control vessels. In each Brillouin image, a small region was selected to perform a higher resolution scan to demonstrate the power of the technique. The instrumented vessel section shows a fully developed TCFA with reduced stiffness in the intimal region, which is expected due to the soft necrotic core of the plaque. In contrast, the control section has no visible plaque and more constant, higher values of stiffness. Owing to shrinkage associated with the fixation process, histology sections are smaller than unfixed Brillouin sections, which is an artefact that is accounted for in the co-registration process. Scale bars, 150 µm. (Online version in colour.)
Figure 2.
Figure 2.
(a) The Brillouin shift was reduced within the instrumented vessel intima (region of TCFA) and media, compared with the entire control sections (**p < 0.01 and *p < 0.05, respectively; the intima and media of control sections are analysed together because they are not easily distinguished in the absence of plaque). Bars are standard deviation. (b) Lipid and collagen stain area (scaled by the maximum of each across all sections to facilitate comparisons) versus Brillouin shift (GHz) for all (20) points of each set of five shift–stain section pairs. Compared with Brillouin shift, lipid showed a strong inverse correlation (mean of −0.67 ± 0.06; p < 0.01) and collagen showed a strong direct correlation (0.71 ± 0.15; p < 0.05). Black line shows fit from linear regression for lipid (LD) and grey line shows fit for collagen (CN) with the associated Spearman correlation coefficient (ρ). (Online version in colour.)

References

    1. Libby P. 2013. Mechanisms of acute coronary syndromes. N. Engl. J. Med. 369, 883–884. (10.1056/NEJMc1307806) - DOI - PubMed
    1. Virmani R, Burke AP, Kolodgie FD, Farb A. 2003. Pathology of the thin-cap fibroatheroma: a type of vulnerable plaque. J. Interv. Cardiol. 16, 267–272. (10.1034/j.1600-0854.2003.8042.x) - DOI - PubMed
    1. Pedrigi RM, de Silva R, Bovens SM, Mehta VV, Petretto E, Krams R. 2014. Thin-cap fibroatheroma rupture is associated with a fine interplay of shear and wall stress. Arterioscler. Thromb. Vasc. Biol. 34, 2224–2231. (10.1161/ATVBAHA.114.303426) - DOI - PubMed
    1. Holzapfel GA, Mulvihill JJ, Cunnane EM, Walsh MT. 2014. Computational approaches for analyzing the mechanics of atherosclerotic plaques: a review. J. Biomech. 47, 859–869. (10.1016/j.jbiomech.2014.01.011) - DOI - PubMed
    1. Scarcelli G, Yun SH. 2007. Confocal Brillouin microscopy for three-dimensional mechanical imaging. Nat. Photon. 2, 39–43. (10.1038/nphoton.2007.250) - DOI - PMC - PubMed

Publication types