Biochemical Monitoring of Spinal Cord Injury by FT-IR Spectroscopy--Effects of Therapeutic Alginate Implant in Rat Models
- PMID: 26559822
- PMCID: PMC4641584
- DOI: 10.1371/journal.pone.0142660
Biochemical Monitoring of Spinal Cord Injury by FT-IR Spectroscopy--Effects of Therapeutic Alginate Implant in Rat Models
Erratum in
-
Correction: Biochemical Monitoring of Spinal Cord Injury by FT-IR Spectroscopy-Effects of Therapeutic Alginate Implant in Rat Models.PLoS One. 2016 Feb 22;11(2):e0150237. doi: 10.1371/journal.pone.0150237. eCollection 2016. PLoS One. 2016. PMID: 26901616 Free PMC article. No abstract available.
Abstract
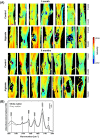
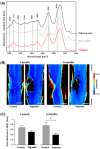
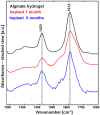
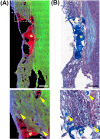
Spinal cord injury (SCI) induces complex biochemical changes, which result in inhibition of nervous tissue regeneration abilities. In this study, Fourier-transform infrared (FT-IR) spectroscopy was applied to assess the outcomes of implants made of a novel type of non-functionalized soft calcium alginate hydrogel in a rat model of spinal cord hemisection (n = 28). Using FT-IR spectroscopic imaging, we evaluated the stability of the implants and the effects on morphology and biochemistry of the injured tissue one and six months after injury. A semi-quantitative evaluation of the distribution of lipids and collagen showed that alginate significantly reduced injury-induced demyelination of the contralateral white matter and fibrotic scarring in the chronic state after SCI. The spectral information enabled to detect and localize the alginate hydrogel at the lesion site and proved its long-term persistence in vivo. These findings demonstrate a positive impact of alginate hydrogel on recovery after SCI and prove FT-IR spectroscopic imaging as alternative method to evaluate and optimize future SCI repair strategies.
Conflict of interest statement
Figures


Similar articles
-
Label-free multiphoton microscopy reveals relevant tissue changes induced by alginate hydrogel implantation in rat spinal cord injury.Sci Rep. 2018 Jul 18;8(1):10841. doi: 10.1038/s41598-018-29140-z. Sci Rep. 2018. PMID: 30022115 Free PMC article.
-
Non-functionalized soft alginate hydrogel promotes locomotor recovery after spinal cord injury in a rat hemimyelonectomy model.Acta Neurochir (Wien). 2018 Mar;160(3):449-457. doi: 10.1007/s00701-017-3389-4. Epub 2017 Dec 11. Acta Neurochir (Wien). 2018. PMID: 29230560
-
Injectable alginate hydrogel loaded with GDNF promotes functional recovery in a hemisection model of spinal cord injury.Int J Pharm. 2013 Oct 15;455(1-2):148-58. doi: 10.1016/j.ijpharm.2013.07.045. Epub 2013 Jul 31. Int J Pharm. 2013. PMID: 23916821
-
Delivery of alginate-chitosan hydrogel promotes endogenous repair and preserves cardiac function in rats with myocardial infarction.J Biomed Mater Res A. 2015 Mar;103(3):907-18. doi: 10.1002/jbm.a.35232. Epub 2014 May 28. J Biomed Mater Res A. 2015. PMID: 24827141
-
Alginate Hydrogels as Scaffolds and Delivery Systems to Repair the Damaged Spinal Cord.Biotechnol J. 2019 Dec;14(12):e1900275. doi: 10.1002/biot.201900275. Epub 2019 Nov 14. Biotechnol J. 2019. PMID: 31677223 Review.
Cited by
-
Label-free differentiation of human pancreatic cancer, pancreatitis, and normal pancreatic tissue by molecular spectroscopy.J Biomed Opt. 2022 Jul 25;27(7):75001. doi: 10.1117/1.JBO.27.7.075001. J Biomed Opt. 2022. PMID: 36399853 Free PMC article.
-
Exploration of macromolecular phenotype of human skeletal muscle in diabetes using infrared spectroscopy.Front Endocrinol (Lausanne). 2023 Dec 21;14:1308373. doi: 10.3389/fendo.2023.1308373. eCollection 2023. Front Endocrinol (Lausanne). 2023. PMID: 38189046 Free PMC article.
-
Nischarin-siRNA delivered by polyethylenimine-alginate nanoparticles accelerates motor function recovery after spinal cord injury.Neural Regen Res. 2017 Oct;12(10):1687-1694. doi: 10.4103/1673-5374.217348. Neural Regen Res. 2017. PMID: 29171434 Free PMC article.
-
Correction: Biochemical Monitoring of Spinal Cord Injury by FT-IR Spectroscopy-Effects of Therapeutic Alginate Implant in Rat Models.PLoS One. 2016 Feb 22;11(2):e0150237. doi: 10.1371/journal.pone.0150237. eCollection 2016. PLoS One. 2016. PMID: 26901616 Free PMC article. No abstract available.
-
Label-free multiphoton microscopy reveals relevant tissue changes induced by alginate hydrogel implantation in rat spinal cord injury.Sci Rep. 2018 Jul 18;8(1):10841. doi: 10.1038/s41598-018-29140-z. Sci Rep. 2018. PMID: 30022115 Free PMC article.
References
-
- Profyris C, Cheema SS, Zang D, Azari MF, Boyle K, Petratos S. Degenerative and regenerative mechanisms governing spinal cord injury. Neurobiol Dis. 2004;15(3): 415–36. - PubMed
-
- Klapka N, Muller HW. Collagen matrix in spinal cord. J. Neurotrauma. 2006;23(3–4): 422–35. - PubMed
-
- Shearer MC, Fawcett JW. The astrocyte/meningeal cell interface—a barrier to successful nerve regeneration? Cell Tissue Res. 2001;305(2): 267–73. - PubMed
-
- David S, Aguayo AJ. Axonal Elongation Into Peripheral Nervous-System Bridges After Central Nervous-System Injury in Adult-Rats. Science. 1981;214(4523): 931–3. - PubMed
-
- Bradbury EJ, McMahon SB. Spinal cord repair strategies: why do they work? Nat Rev Neurosci. 2006;7(8): 644–53. - PubMed
Publication types
MeSH terms
Substances
LinkOut - more resources
Full Text Sources
Other Literature Sources
Medical

