. 2015 Nov 12:5:16495.
doi: 10.1038/srep16495.

NPM1 histone chaperone is upregulated in glioblastoma to promote cell survival and maintain nucleolar shape

Affiliations

NPM1 histone chaperone is upregulated in glioblastoma to promote cell survival and maintain nucleolar shape

Karl Holmberg Olausson et al. Sci Rep. .

Abstract

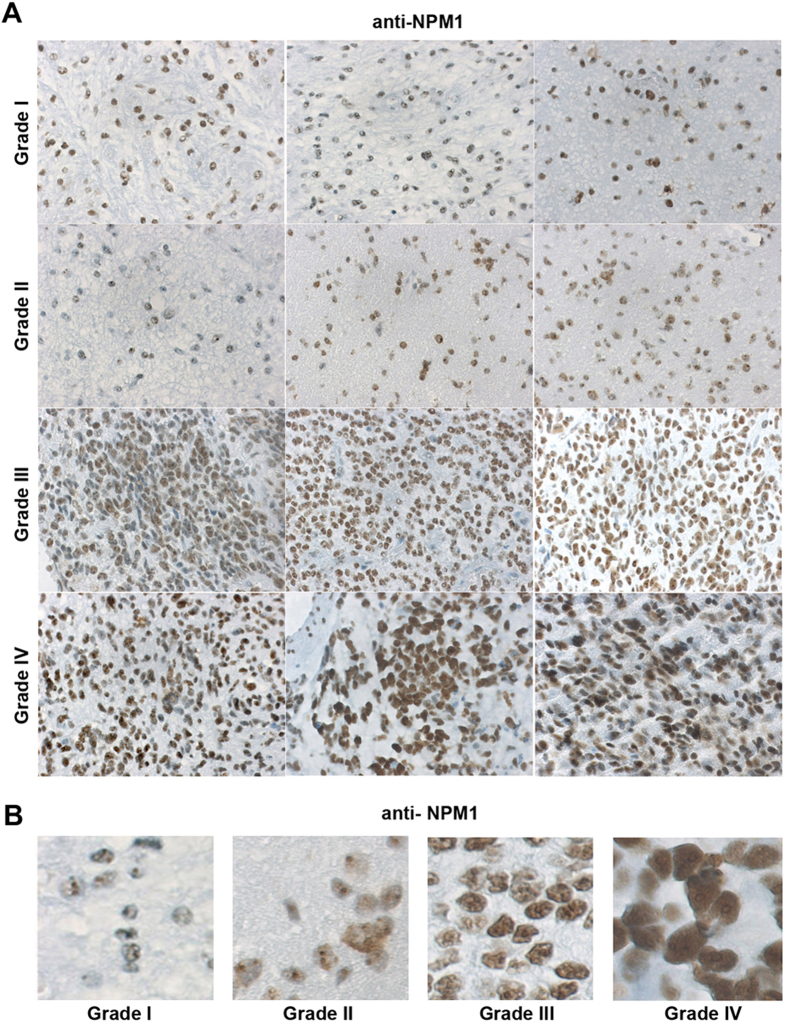
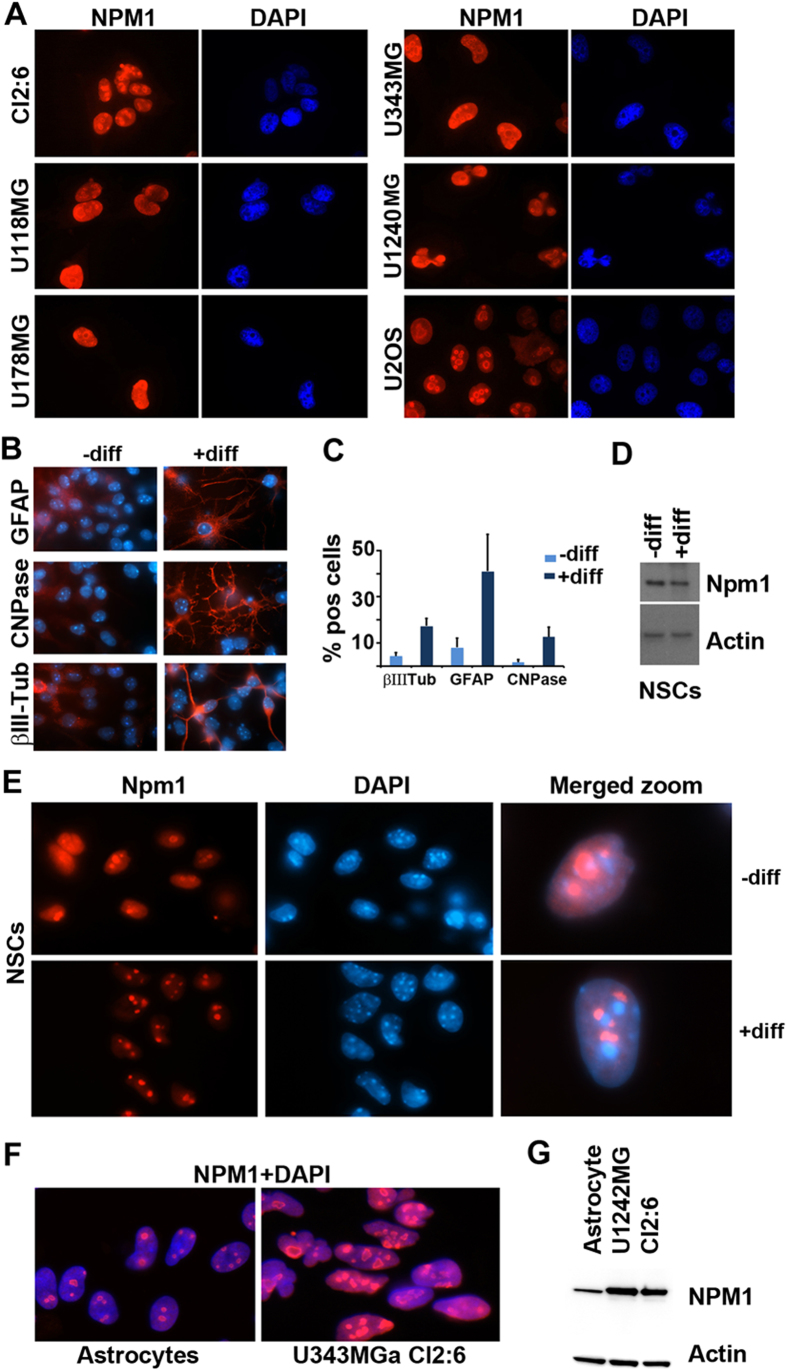
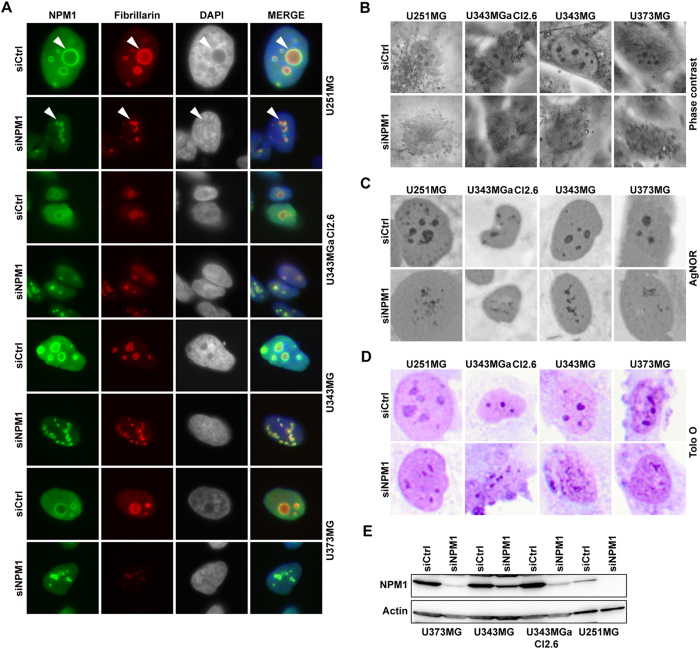
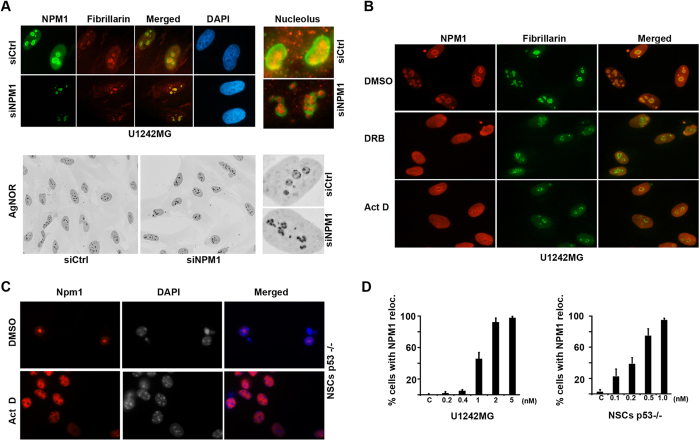
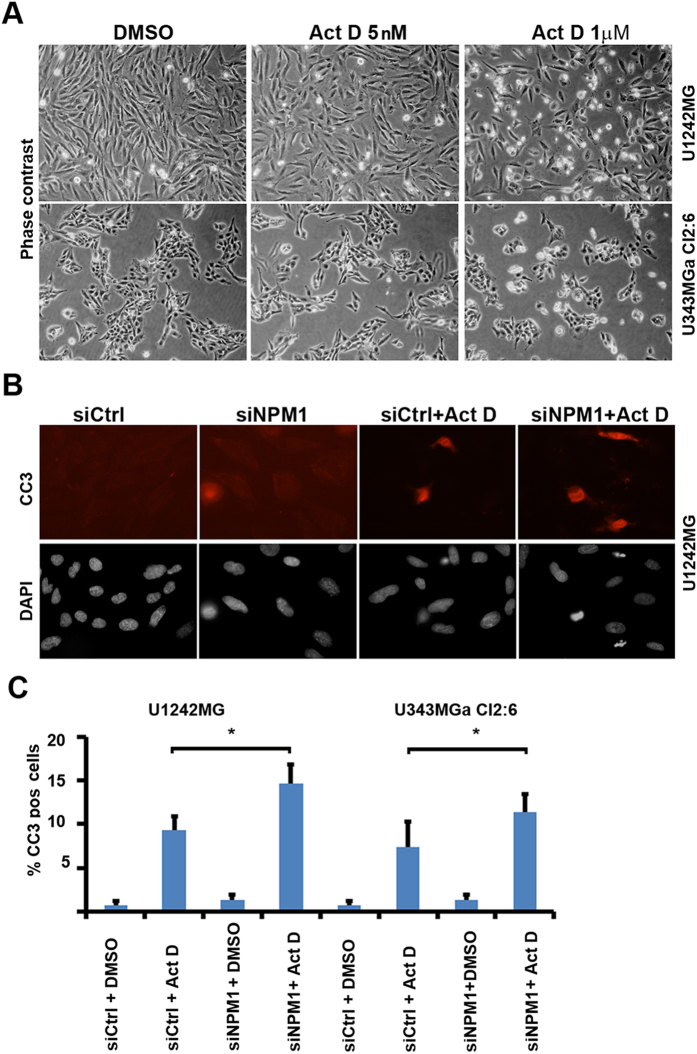
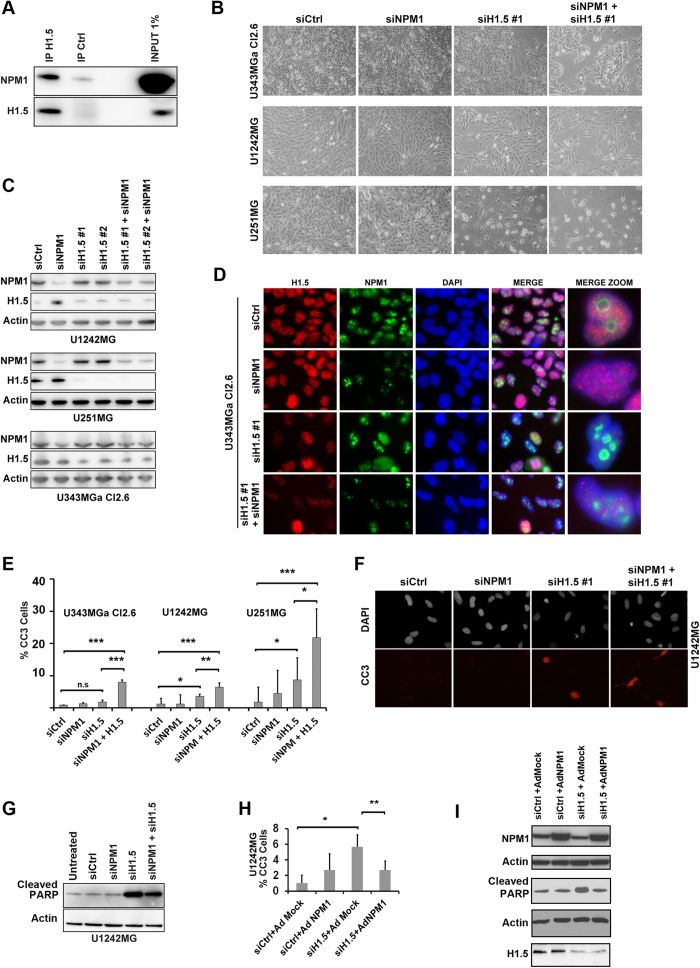
Glioblastoma (grade IV glioma) is the most common and aggressive adult brain tumor. A better understanding of the biology of glioblastoma cells is crucial to identify molecular targets stimulating cell death. NPM1 (nucleophosmin) is a multifunctional chaperone that plays an important role in cancer development. Herein, NPM1 was analyzed by immunohistochemistry in human astrocytic gliomas. NPM1 was detected in all tumors but with a significantly higher staining intensity in grade IV than in low grade tumors. Depletion of NPM1 had only modest effects on the viability of U251MG, U1242MG, and U343MGa Cl2:6 glioma cells, despite alterations in nucleolar morphology. Glioma cell cultures depleted of NPM1 exposed to micromolar levels of actinomycin D were more prone to cell death (apoptosis) compared to cultures retaining NPM1. We had previously found that NPM1 binds to linker histone H1.5. Here we could show that silencing of H1.5 triggered glioma cell apoptosis as evidenced by a marked increase in both the numbers of cleaved caspase-3(+) cells and in the amounts of cleaved PARP. Enforced expression of NPM1 suppressed apoptosis in H1.5 depleted glioma cells. Although our studies would suggest little effectiveness of targeting NPM1 alone there could be potential using it as a combination treatment.


Figures

Figure 1
Figure 1. Detection of NPM1 in astrocytic gliomas.
(A) Immunohistochemical staining of NPM1 (brown) in astrocytic glioma tumors of grades I, II, III and IV. Three tumor samples from different patients are shown for each grade. Obj. 20x. (B) Representative zoom-in micrographs showing NPM1 staining in tumor samples of different grades (I-IV).
Figure 2
Figure 2. Levels and localization of NPM1 in human glioma cell lines and mouse neural stem cells.
(A) IF staining of NPM1 (red) in glioma cell lines as indicated in the figure. Nuclei were counterstained with DAPI (blue). U2OS osteosarcoma cells were used in comparison. (B) IF staining (red) of GFAP (astrocyte marker), CNPase (oligodendrocyte marker) and βIII-tubulin (neuronal marker) in either undifferentiated (–diff) or differentiated (+diff) mouse wild type NSCs. Nuclei were counterstained with DAPI (blue) and shown merged with the red signal. In this experiment, mouse NSCs were growing as spheres and thereafter dissociated onto laminin coated coverslips and induced to differentiate or maintained in an undifferentiated state. (C) Percentages of GFAP+, CNPase+, and βIII-tubulin+ cells in undifferentiated (–diff) or differentiated (+diff) mouse NSCs. Results are given as the average percentage (%) of cells expressing the respective marker and error bars represent the standard deviation. Shown is the result from one representative experiment performed in triplicate and 300 cells were evaluated for each marker and coverslip. (D) IB analysis of Npm1 in either undifferentiated (–diff) or differentiated (+diff) mouse NSCs. β-actin served as loading control. (E) IF staining of Npm1 (red) in undifferentiated (–diff) or differentiated (+diff) mouse NSCs. Right panel: merged (Npm1+DAPI) zoom-in of representative cells. (F) IF staining of NPM1 (red) in normal cortical rat astrocytes and in human glioma cell line U343MGa Cl2:6. (G) IB analysis of NPM1 levels in astrocytes and glioma cell lines U1242MG and U343MGa Cl2:6. β-actin served as loading control.
Figure 3
Figure 3. Knockdown of NPM1 in glioma cells alters nucleolar morphology.
(A) IF staining of NPM1 (green) and fibrillarin (red) in glioma cell lines U343MGa Cl2:6, U373MG, U343MG, and U251MG treated with siNPM1 for 6 days. Nuclei were counterstained with DAPI. Arrowheads point at nucleoli. (B) Phase contrast micrographs of control and of cells depleted of NPM1. (C) AgNOR staining of control and NPM1 depleted glioma cells. (D) Acidic Toluidine Blue O staining of glioma cells. Nucleoli appear as darker stained than the surrounding nucleoplasm. (E) IB analysis of NPM1 levels in different glioma cell lines as indicated after siNPM1 treatment for 6 days. β-actin served as loading control.
Figure 4
Figure 4. NPM1 re-distribution serves as a marker for nucleolar stress in glioma and neural stem cells.
(A) Upper panel: U1242MG cells were transfected with either siCtrl or siNPM1 for 6 days and subsequently subjected to double IF staining for NPM1 (green) and fibrillarin (red). Nuclei were identified by DAPI. Lower panel: representative micrographs of AgNOR stained U1242MG cells either depleted of NPM1 or siCtrl treated. (B) U1242MG cells were treated with Act D (5 nM) or DRB (25μg/ml) for 8 hours and thereafter the cells were fixed, permeabilized, and IF stained for NPM1 (red) and fibrillarin (green). (C) IF staining of Npm1 in differentiated mouse p53−/− NSCs. Nuclei were identified by DAPI. The NSCs were grown as spheres and thereafter dissociated onto laminin-coated coverslips and induced to differentiate. Npm1 (red) localizes to nucleoli in DMSO-treated cells but is increasingly localized to the nucleoplasm in Act D-treated cells. (D) Quantification of U1242MG cells (left panel) and mouse p53−/− NSCs displaying NPM1 re-localization from the nucleolus to the nucleoplasm using different concentrations of Act D. Shown is the average percentage of cells from one representative experiment performed in triplicate. Error bars represent the standard deviation. In total 300 cells were evaluated per concentration and cell type.
Figure 5
Figure 5. NPM1 influences sensitivity to actinomycin D induced glioma cell apoptosis.
(A) Phase contrast photomicrographs of DMSO (control) and Act D treated U1242MG and U343MGa Cl2:6 cells. Cells were treated for 24 hours. (B) IF staining for cleaved caspase 3 (CC3, red). Nuclei were counterstained with DAPI (grey). Apoptosis is increased in U1242MG cells silenced for NPM1 and then challenged with Act D (5 nM) for 24 hours. The cells were transfected with either siNPM1 or siCtrl for 4 days prior to the addition of Act D or DMSO. (C) Quantification of (%) CC3+ U1242MG and U343MGa Cl2:6 cells. Shown is the average percentage of CC3+ cells for each treatment category stemming from three independent biological replicates in triplicate. Error bars represent standard deviation and statistical significance is indicated (*P < 0.05, two-tailed t-test). Approximately 1000 cells were evaluated for each condition.
Figure 6
Figure 6. Depletion of linker histone H1.5 induces apoptosis in glioma cells and this is modulated by NPM1.
(A) Identification of linker histone H1.5 as an NPM1 associated protein. H1.5 co-immunoprecipitation showed increased levels of NPM1 bound to H1.5 when compared to isotype (IgG antibody) control according to IB analysis. (B) Morphological appearance of glioma cell cultures (U343MGa Cl2:6, U1242MG, and U251MG) depleted of NPM1, H1.5 or a combination. Cell cultures were transfected with siRNA targeting NPM1 (siNPM1 pool) or two different siRNA pools targeting H1.5 (siH1.5 #1 and siH1.5 #2), or combinations as indicated. For experiments in panels B-G the following time line was used: cells were treated with siNPM1 for an initial 3 days after which cells were further treated with siNPM1 and siH1.5 alongside controls for 3 days. (C) Knockdown of NPM1 and H1.5 in glioma cells as evidenced by IB analyses. (D) Knockdown of NPM1 and H1.5 in glioma cell line U343MGa Cl2:6 visualized by IF staining for H1.5 (red), NPM1 (green), and DAPI (blue). Far right panel shows zoom-in of cells representing specific cell phenotypes. (E) Quantification of (%) cells expressing cleaved caspase 3 (CC3) in control, siNPM1, siH1.5 and siNPM1+siH1.5 treated glioma cell lines. (F) IF staining of cleaved caspase 3 (CC3, red) and DAPI in cells treated with siNPM1 and siH1.5. (G) IB analysis of the amounts of cleaved PARP in cells treated with siNPM1, siH1.5 or a combination. β-actin served as loading control. (H) U1242MG cell cultures infected with NPM1 (Ad-NPM1) show decreased caspase-3 activation when compared with mock (Ad-Mock) infected cells. Shown is the average percentage of CC3+ cells for each treatment category from three independent biological replicates each in triplicate. Error bars represent standard deviation and statistical significance is indicated. Statistical analysis was done according to one way analysis of variance (ANOVA) with Tukey-Kramer post-hoc test (*P < 0.05, **P < 0.01, ***P < 0.001). (I) IB analyses of NPM1, cleaved PARP, and H1.5 levels in U1242MG cells, corresponding to the experimental set-up used in the H panel. β-actin served as loading control, note that two separate blot membranes were used.

Similar articles

Cited by

References

    1. Van Meir E. G. et al. Exciting new advances in neuro-oncology: the avenue to a cure for malignant glioma. CA. Cancer J. Clin. 60, 166–193, 10.3322/caac.20069 (2010). - DOI - PMC - PubMed
    1. Huse J. T. & Holland E. C. Targeting brain cancer: advances in the molecular pathology of malignant glioma and medulloblastoma. Nature reviews. Cancer 10, 319–331, 10.1038/nrc2818 (2010). - DOI - PubMed
    1. Louis D. N. et al. The 2007 WHO classification of tumours of the central nervous system. Acta Neuropathol 114, 97–109 (2007). - PMC - PubMed
    1. Furnari F. B. et al. Malignant astrocytic glioma: genetics, biology, and paths to treatment. Genes Dev. 21, 2683–2710 (2007). - PubMed
    1. Belkacemi L. & Hebb M. O. HSP27 knockdown produces synergistic induction of apoptosis by HSP90 and kinase inhibitors in glioblastoma multiforme. Anticancer Res. 34, 4915–4927 (2014). - PubMed

Publication types

MeSH terms