. 2015 Nov 26;527(7579):525-530.
doi: 10.1038/nature16064. Epub 2015 Nov 11.

Epithelial-to-mesenchymal transition is dispensable for metastasis but induces chemoresistance in pancreatic cancer

Affiliations

Epithelial-to-mesenchymal transition is dispensable for metastasis but induces chemoresistance in pancreatic cancer

Xiaofeng Zheng et al. Nature. .

Abstract

Diagnosis of pancreatic ductal adenocarcinoma (PDAC) is associated with a dismal prognosis despite current best therapies; therefore new treatment strategies are urgently required. Numerous studies have suggested that epithelial-to-mesenchymal transition (EMT) contributes to early-stage dissemination of cancer cells and is pivotal for invasion and metastasis of PDAC. EMT is associated with phenotypic conversion of epithelial cells into mesenchymal-like cells in cell culture conditions, although such defined mesenchymal conversion (with spindle-shaped morphology) of epithelial cells in vivo is rare, with quasi-mesenchymal phenotypes occasionally observed in the tumour (partial EMT). Most studies exploring the functional role of EMT in tumours have depended on cell-culture-induced loss-of-function and gain-of-function experiments involving EMT-inducing transcription factors such as Twist, Snail and Zeb1 (refs 2, 3, 7-10). Therefore, the functional contribution of EMT to invasion and metastasis remains unclear, and genetically engineered mouse models to address a causal connection are lacking. Here we functionally probe the role of EMT in PDAC by generating mouse models of PDAC with deletion of Snail or Twist, two key transcription factors responsible for EMT. EMT suppression in the primary tumour does not alter the emergence of invasive PDAC, systemic dissemination or metastasis. Suppression of EMT leads to an increase in cancer cell proliferation with enhanced expression of nucleoside transporters in tumours, contributing to enhanced sensitivity to gemcitabine treatment and increased overall survival of mice. Collectively, our study suggests that Snail- or Twist-induced EMT is not rate-limiting for invasion and metastasis, but highlights the importance of combining EMT inhibition with chemotherapy for the treatment of pancreatic cancer.


Figures

Extended Figure 1
Extended Figure 1
A Representative H&E images of small intestine (SmInt), kidney, and heart (scale, 100μm). B Pancreatic mass of (n = 29, 13, and n = 28 mice; s.d.; one-way ANOVA). C Merge of Twist1 or Snai1 in situ hybridization (black) followed by CK8 (red) immunolabeling in tumors from KPC and KPC; TwistcKO or KPC; SnailcKO mice, respectively. White arrows highlight positive cells in the stroma while yellow arrows highlight negative epithelium (scale, 50 μm). D Twist or Snail immunostaining in KPC and KPC; TwistcKO or KPC; SnailcKO tumors, respectively. Black arrows highlight positive cells in the stroma while red arrows highlight negative epithelium (scale, 20 μm). E Channel separations of the representative images of αSMA immunolabeling in YFP lineage traced tumors found in Figure 1F (scale, 50 μm). F EMT gene expression signature analysis in KPC, KPC; TwistcKO and KPC; SnailcKO cohorts (n = 3 mice). Red arrows indicate reduced Twist1 and Snai1 expression in KPC; TwistcKO and KPC; SnailcKO cohorts, respectively.
Extended Figure 2
Extended Figure 2
A E-Cadherin immunolabeling and quantification of primary KPC (n = 5 mice), KPC; TwistcKO (n = 5 mice) and KPC; SnailcKO (n = 4 mice) (scale, 100 μm). B Zeb2 immunolabeling and quantification of primary KPC (n = 6 mice), KPC; TwistcKO (n = 5 mice) and KPC; SnailcKO (n = 7 mice) (scale, 50 μm; inset scale, 20 μm). C Sox4 immunolabeling and quantification of primary KPC (n = 7 mice), KPC; TwistcKO (n = 6 mice) and KPC; SnailcKO (n = 8 mice) (scale, 50 μm; inset scale, 20 μm). D Slug immunolabeling and quantification of primary KPC (n = 4 mice), KPC; TwistcKO (n = 4 mice) and KPC; SnailcKO (n = 4 mice) tumors (scale, 50 μm; inset scale, 20 μm). E Sirius Red staining and quantification of primary KPC (n = 21 mice), KPC;TwistcKO (n = 8 mice) and KPC;SnailcKO (n = 11 mice) (scale, 200 μm; s.d.) F αSMA immunolabeling and quantification of primary KPC (n = 5 mice), KPC;TwistcKO (n = 5 mice) and KPC;SnailcKO (n = 5 mice) (scale, 100 μm). G CD31 immunolabeling and quantification of primary KPC (n = 4 mice), KPC;TwistcKO (n = 4 mice) and KPC;SnailcKO (n = 3 mice) (scale, 200 μm, inset scale, 100 μm). H Pimonidazole staining and quantification of primary KPC (n = 4 mice), KPC; TwistcKO (n = 4 mice) and KPC; SnailcKO (n = 4 mice) (scale, 100 μm). I CD3 immunolabeling and quantification of primary KPC (n = 5 mice), KPC;TwistcKO (n = 5 mice) and KPC;SnailcKO (n = 5 mice) (scale, 100 μm; inset scale, 25 μm). Unless otherwise indicated error bars represent s.e.m, and significance determined by One-way ANOVA. *P < 0.05, ** P <0.01, *** P <0.001. ns, not significant.
Extended Figure 3
Extended Figure 3
A Immunolabeling of primary tumors (n = 3 mice) for αSMA (red), CK8 (green), Ki-67 (white) and DAPI (blue); yellow arrows point to EMT+ cells (scale, 20 μm). B Representative dot plots of circulating YFP+ cells. C Images of serial sections of KPC; LSL-YFP lung and liver metastasis stained for H&E or immunolabeled for CK19 or YFP. Yellow dashed box represents magnified areas in panel below (scale, 200 μm; magnification scale, 100 μm). D KPC metastatic tumors stained for Twist and Snail (n = 3 mice; scale, 50 μm; inset scale, 20 μm). E Zeb1 immunolabeling and quantification of metastatic KPC (n = 4 mice), KPC; TwistcKO (n = 3 mice) and KPC; SnailcKO (n = 4 mice) (scale, 50 μm; inset scale, 20 μm). F αSMA immunolabeling and quantification of metastatic KPC (n = 3 mice), KPC; TwistcKO (n = 3 mice) and KPC; SnailcKO (n = 3 mice) (scale, 50 μm; inset scale, 20 μm). G E-Cadherin staining on serial sections of αSMA immunolabeling and quantification of metastatic KPC (n = 4 mice), KPC; TwistcKO (n = 3 mice) and KPC; SnailcKO (n = 4 mice) (scale, 50 μm; inset scale, 20 μm).H Ki-67 immunolabeling and quantification of metastatic KPC (n = 7 mice), KPC; TwistcKO (n = 3 mice) and KPC; SnailcKO (n = 3 mice) (scale, 50 μm). Unless otherwise indicated error bars represent s.e.m, percentages indicated represent percent decrease from control, and significance determined by One-way ANOVA. * P <0.05, ** P <0.01, *** P <0.001. ns, not significant.
Extended Figure 4
Extended Figure 4
A Brightfield micrograph of cultured primary KPC, KPC; TwistcKO and KPC; SnailcKO cells (scale, 50 μm). B EMT and gemcitabine transport related gene expression shown by qPCR analysis in KPC (n = 3-4 cell lines), KPC; TwistcKO (n = 5 cell lines) and KPC; SnailcKO (n = 5-6 cell lines) (s.d., one-tailed t-test, * P < 0.05, numbers list non-significant P values. nd: not detected, ns: not significant). C MTT assay showing cell proliferation in KPC, KPC; TwistcKO and KPC; SnailcKO cells (n = 8, 8, and 8 biological replicates of a cell line for each genotype). D Relative cell viability (MTT assay) in cultured KPC, KPC; TwistcKO and KPC; SnailcKO cells treated with gemcitabine or erlotinib (n = 8, 8, and 8 biological replicates of a cell line for each genotype). Unless otherwise indicated error bars represent s.e.m, significance was determined by one-way ANOVA. ** P <0.01, *** P <0.001, **** P <0.0001.
Extended Figure 5
Extended Figure 5
A Representative H&E images (scale, 100 μm). B Relative percentage of each histological tissue phenotype of KTC (n = 8 mice) and KTC; SnailcKO (n = 6 mice) primary tumors (s.d.). C Primary tumor invasiveness in KTC (n = 8 mice) and KTC; SnailcKO (n = 6 mice) (s.d.). D Pancreatic mass in KTC (n = 5 mice) and KTC; SnailcKO (n = 6 mice) (s.d.). E Immunolabeling and quantification of primary KTC (n = 5 mice), KTC; SnailcKO (n = 4 mice) for αSMA (red), CK8 (green) and DAPI (blue); white arrows indicate double positive cells (scale, 20 μm), Zeb1 (scale, 50 μm; inset scale. 20μm), cleaved caspase-3 (scale, 50 μm; n = 4 and 4 mice), Ki-67 (scale, 100 μm), ENT2 (scale, 100 μm) and CNT3 (scale, 100 μm). Unless otherwise indicated error bars represent s.e.m, and significance determined by two-tailed t-test. * P <0.05, *** P <0.001. ns, not significant.
Extended Figure 6
Extended Figure 6
A-B Staining and quantification of (A) KTC (n = 5 or 6 mice), KTC; SnailcKO (n = 4 or 5 mice) (B) KTC + GEM (n = 4 or 5 mice), KTC; SnailcKO + GEM (n = 5 mice) for Masson's Trichrome Stain (MTS) (scale, 200 μm), Sirius Red staining (scale, 200 μm), and ENT1 (scale, 100 μm). Error bars represent s.d. (MTS and Sirius Red) or s.e.m. (ENT1), and significance determined by two-tailed t-test. ns, not significant.
Figure 1
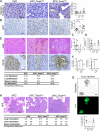
Figure 1. EMT inhibition does not alter primary tumor progression
A Representative H&E stained primary tumors (scale; 100μm). B Relative percentages of each primary tumor histological tissue phenotype (n = 31, 14, and 30 mice; s.d.). C Local invasiveness (n = 31, 14, and 30 mice; s.d.). D Overall survival (n = 29, 12, and 33 mice). E Twist1 or Snai1 in situ hybridization (black) with CK8 (red) immunolabeling in primary tumors (n = 3 mice for all groups) relative percentage of Twist1+CK8+ or Snai1+CK8+ double positive cells (scale, 50μm; two-tailed t-test). F αSMA immunolabeling in YFP lineage traced tumors (n = 3 and 3 mice; scale, 50μm; two-tailed t-test). G αSMA (red), CK8 (green) and DAPI (blue); white arrows indicate double positive cells (n = 4 mice for all groups; scale, 20μm). H Zeb1 (n = 5, 6, and 6 mice; scale, 50 μm; inset scale, 20 μm). I Masson's Trichrome Stain (MTS) (n = 8, 7, and 7 mice; scale, 200 μm; s.d.). Unless otherwise indicated error bars represent s.e.m, percentages represent percent change from control and significance determined by oneway ANOVA. *P < 0.05, ** P <0.01, *** P <0.001, **** P <0.0001. ns, not significant.
Figure 2
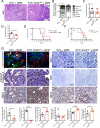
Figure 2. EMT inhibition does not alter invasion and metastasis
Primary tumor immunolabeling for (A) Cleaved caspase-3 (n = 6 mice for all groups; scale, 50μm) and (B) Ki-67 (n = 7, 7, and 9 mice; scale, 100 μm). C Percentage of YFP+ circulating tumor cells (CTC) (n = 8 and 8 mice; two-tailed t-test; s.d.). D KrasG12D expression in whole blood cell pellets (n = 5, 3, and 5 mice; s.d.). E H&E and CK19 immunolabeling of metastatic liver nodules. Metastatic tumor (T) nodules outlined by a dotted line (scale, 100μm). Table representing the number of positive tissues out of total tissues examined (χ2 analysis). F Expression analysis of Twist1 and Snai1 in cultured primary tumor cell lines (n = 4 and 5 or 4 and 6 individual cell lines; one-tailed t-test of ΔCt; s.d.). G Brightfield or YFP images and quantification of sphere number in cultured tumor cell lines (n = 3, 2, and 3 individual cell lines; scale, 50μm). H H&E images (scale, 100μm) of colonized lungs from i.v. injected cultured primary tumor cell lines KPC (n = 5 and 5 mice for each cell line) and KPC; TwistcKO (n = 11 and 4 mice for each cell line) and KPC; SnailcKO (n = 4, 5, and 5 mice for each cell line). Table representing the number of colonized tissues out of total tissues examined (χ2 analysis). Unless otherwise indicated error bars represent s.e.m and significance determined by one-way ANOVA. * P <0.05, ** P <0.01, **** P <0.0001. ns, not significant. nd, not detected.
Figure 3
Figure 3. EMT inhibition sensitizes tumors to gemcitabine in KPC GEMM
Primary tumor immunolabeling for (A) ENT1, (B) ENT2, and (C) CNT3 (n = 6, 5, and 4 mice; scale, 100 μm; s.e.m., two-tailed t-test). D MRI tumor volumes of KPC + GEM (n = 13 mice, 10 died before Day 19), KPC; TwistcKO + GEM (n = 15 mice, 6 died before Day 19) and KPC; SnailcKO + GEM (n = 20 mice, 9 died before Day 19) (one-way ANOVA comparing mean tumor volumes on Day 0 and Day 19, respectively). E Survival on gemcitabine treatment to end point (Day 21). F H&E stained primary tumors (scale, 100μm). G Relative percentages of each histological tissue phenotype of end point mice (n = 3, 9, and 11 mice; s.d.; two-tailed t-test). * P <0.05, ** P <0.01. ns, not significant.
Figure 4
Figure 4. EMT inhibition sensitizes tumors to gemcitabine in KTC GEMM
Primary tumor (A) H&E (scale, 100 μm) and (B) relative percentage of each histological tissue phenotype (n = 5 and 7 mice; s.d.) C Local invasiveness (n = 5 and 7 mice; s.d.). D Pancreatic mass (n = 3 and 4 mice; s.d.). E Overall survival of KTC + GEM (n = 8 mice) and KTC; SnailcKO + GEM (n = 4 mice). F Overall survival of KTC (n = 6 mice) and KTC; SnailcKO (n = 3 mice). G αSMA (red), CK8 (green) and DAPI (blue); white arrows indicate double positive cells (n = 4 mice; scale, 20 μm), Zeb1 (n = 4 and 5 mice; scale, 50 μm; inset scale, 20μm), cleaved caspase-3 (n = 4 and 5 mice; scale, 50 μm), Ki-67 (n = 4 and 5 mice; scale, 100 μm), ENT2 (n = 5 mice; scale, 100 μm), and CNT3 (n = 5 mice; scale, 100 μm). Unless otherwise indicated error bars represent s.e.m and significance determined by two-tailed t-test. * P <0.05, ** P <0.01, *** P <0.001. ns, not significant.

Comment in

References

    1. Hotz B, et al. Epithelial to mesenchymal transition: expression of the regulators snail, slug, and twist in pancreatic cancer. Clinical cancer research : an official journal of the American Association for Cancer Research. 2007;13:4769–4776. doi:10.1158/1078-0432.CCR-06-2926. - PubMed
    1. Arumugam T, et al. Epithelial to mesenchymal transition contributes to drug resistance in pancreatic cancer. Cancer research. 2009;69:5820–5828. doi:10.1158/0008-5472.CAN-08-2819. - PMC - PubMed
    1. Taube JH, et al. Core epithelial-to-mesenchymal transition interactome gene- expression signature is associated with claudin-low and metaplastic breast cancer subtypes. Proceedings of the National Academy of Sciences of the United States of America. 2010;107:15449–15454. doi:10.1073/pnas.1004900107. - PMC - PubMed
    1. Rhim AD, et al. EMT and dissemination precede pancreatic tumor formation. Cell. 2012;148:349–361. doi:10.1016/j.cell.2011.11.025. - PMC - PubMed
    1. Kalluri R, Weinberg RA. The basics of epithelial-mesenchymal transition. The Journal of clinical investigation. 2009;119:1420–1428. doi:10.1172/jci39104. - PMC - PubMed

Publication types

MeSH terms

Associated data