. 2016 Feb;40(1):1-26.
doi: 10.1007/s10827-015-0581-5. Epub 2015 Nov 11.

Dynamic effective connectivity in cortically embedded systems of recurrently coupled synfire chains

Affiliations

Dynamic effective connectivity in cortically embedded systems of recurrently coupled synfire chains

Chris Trengove et al. J Comput Neurosci. 2016 Feb.

Abstract

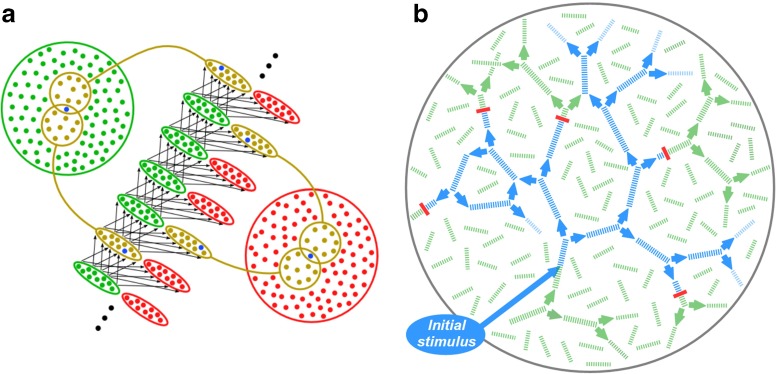
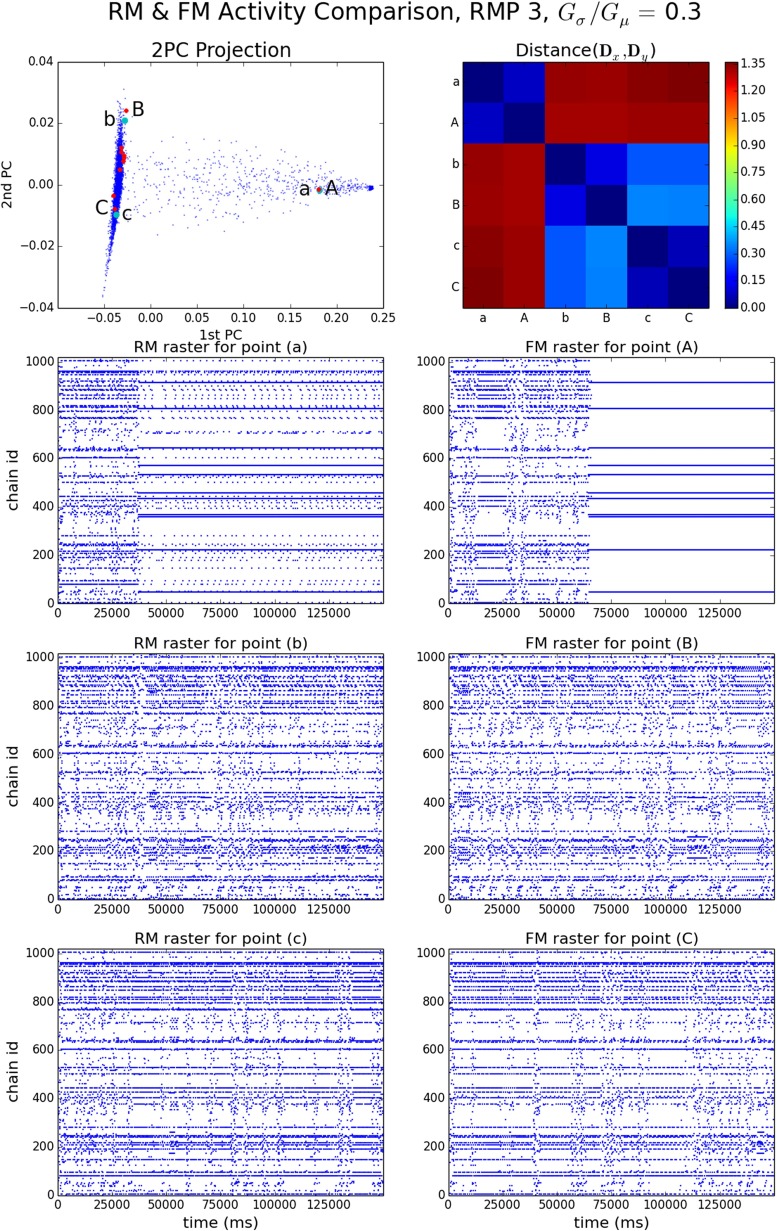
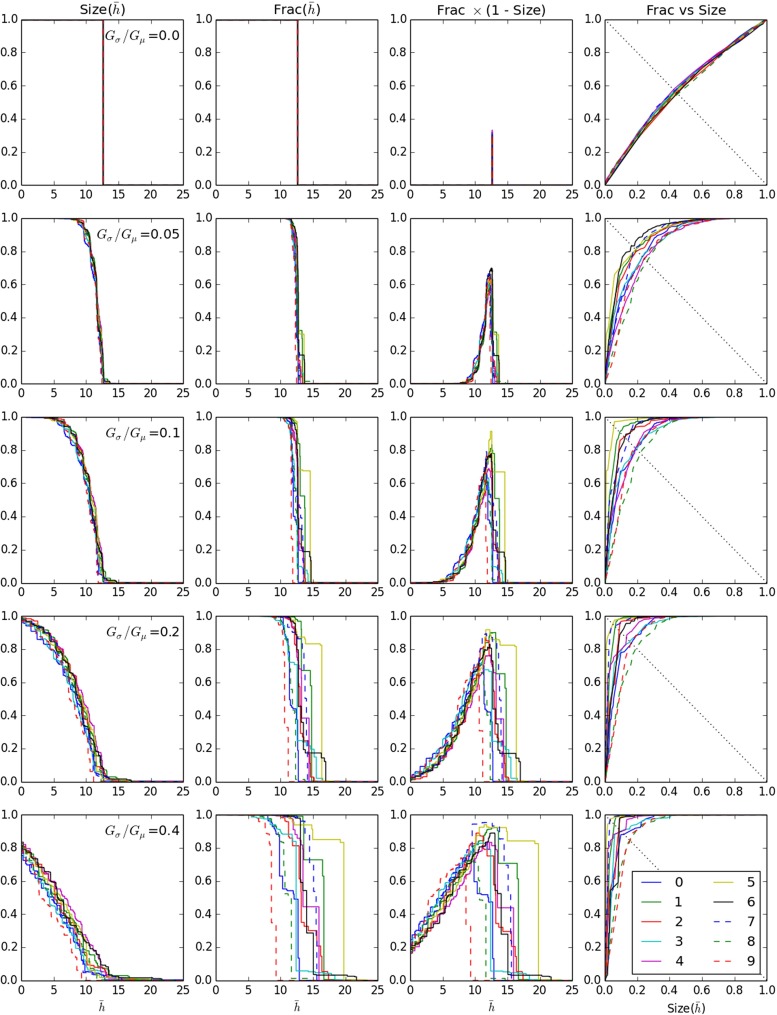
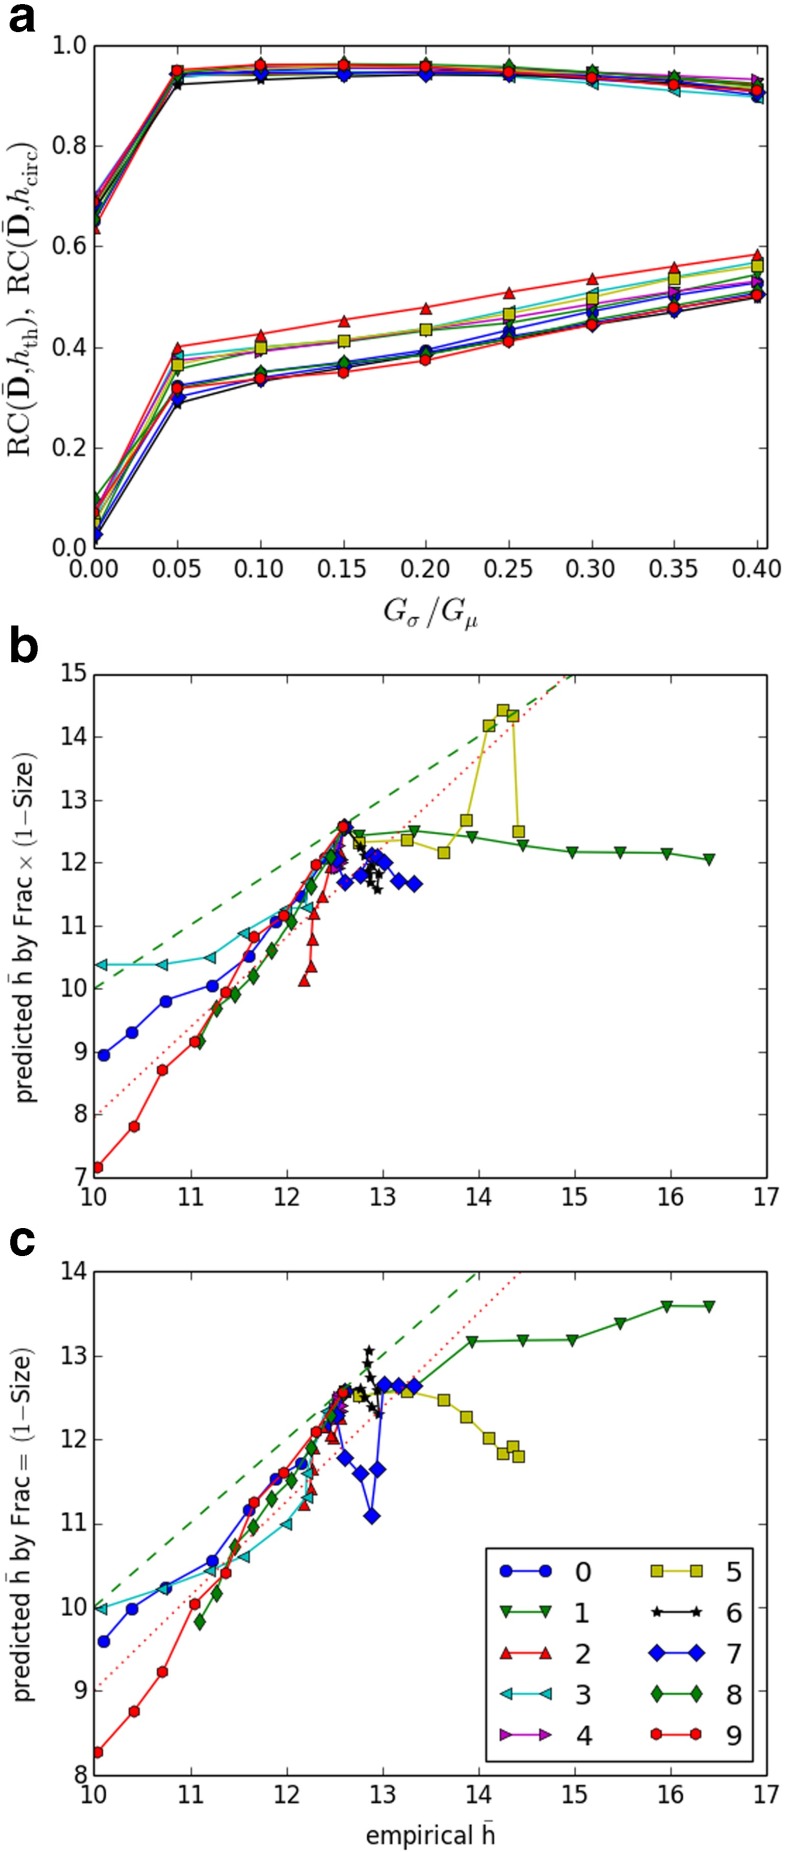
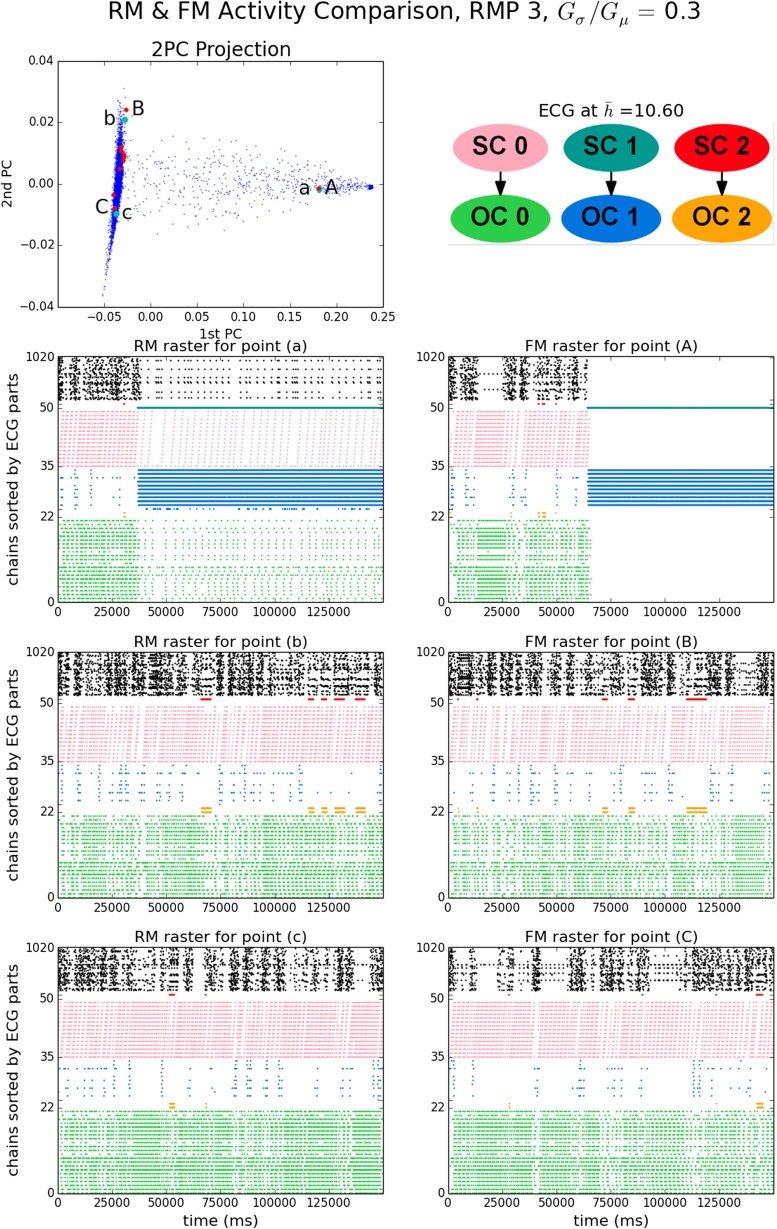
As a candidate mechanism of neural representation, large numbers of synfire chains can efficiently be embedded in a balanced recurrent cortical network model. Here we study a model in which multiple synfire chains of variable strength are randomly coupled together to form a recurrent system. The system can be implemented both as a large-scale network of integrate-and-fire neurons and as a reduced model. The latter has binary-state pools as basic units but is otherwise isomorphic to the large-scale model, and provides an efficient tool for studying its behavior. Both the large-scale system and its reduced counterpart are able to sustain ongoing endogenous activity in the form of synfire waves, the proliferation of which is regulated by negative feedback caused by collateral noise. Within this equilibrium, diverse repertoires of ongoing activity are observed, including meta-stability and multiple steady states. These states arise in concert with an effective connectivity structure (ECS). The ECS admits a family of effective connectivity graphs (ECGs), parametrized by the mean global activity level. Of these graphs, the strongly connected components and their associated out-components account to a large extent for the observed steady states of the system. These results imply a notion of dynamic effective connectivity as governing neural computation with synfire chains, and related forms of cortical circuitry with complex topologies.

Keywords: Background synaptic noise; Combinatorial representation; Effective connectivity; Metastability; Recurrent network dynamics; Synfire chains.


Figures

Fig. 1
Fig. 1
(color online) a Construction of synfire chain embedding in a population of neurons. A sequence of excitatory pools (green ellipses) is formed by randomly selecting n E distinct neurons from the excitatory population (large green circle) with replacement to form each pool; two such selections are indicated in brown. A corresponding sequence of inhibitory pools (red) is formed from the inhibitory population (red). Each neuron appears in many pools; e.g. each of the neurons in blue appears in two of the pools shown. Links consist of all-to-all connections from each excitatory pool to the next excitatory pool as well as to the corresponding inhibitory pool (arrows). b Pairwise couplings (green arrows) between chains (green line segments) form a recurrent structure in which each chain has exactly two successors, chosen at random. For clarity the inhibitory pools are not shown. An initial pulse packet stimulus is the ancestor of a branching tree of ongoing pulse packet activity (blue), limited in size by extinctions (red). Loops may also be encountered
Fig. 2
Fig. 2
(color online) a Wave propagation probability P^s(λE,gE,L0) estimated from simulations (red) and from the model given by Eq. (3) (blue) for g E/G μ ∈ {0.5,0.54,…,1.4}. b g E-dependence of λ E,th, the threshold for 50 % wave propagation probability from sigmoidal fits to P^s(λE,gE,L0), for individual g E values (red) and fitted to a quadratic (blue). c The relationship between the sigmoid widths λ E, σ and the thresholds λ E,th is approximated by a linear relationship λ E,σ = c λ E,th. d The h- λ E relationships based on the expected contribution to the population mean firing rate made by each each wave, ν W,1(λ E, G σ) (red lines); and setting ν W,1 to a constant value of ν W,1(λ E,th(G μ),0.0015) (blue line)
Fig. 3
Fig. 3
Ongoing activity versus time during the first 8000 ms of an FM run (RMP 3, G σ/G μ = 0.3, run 8). a, b: firing rate and number of waves versus time. c: all detected pulse packets (blue) versus time. Those which are end events are also marked in red. d, e: enlargements of boxed areas in c, d respectively. Each dot in ce represents a temporally localized packet of spikes in a pool of neurons
Fig. 4
Fig. 4
a Mean number of waves versus chain strength variability for RMPs 0,…,9, left panel FM, right panel RM; b Entropy of RM (blue) and FM (red) NEECs averaged over runs versus chain strength variability for RMPs 0,…,9. Also shown is the entropy of the mean NEEC (green). Error bars in A and B give standard deviation over runs. c Mean number of waves versus mean entropy for RMPs 0,…,9 and G σ/G μ ∈ {0.0,0.05,…,0.4}. The curves for different RMPs diverge from the common point as G σ/G μ increases. d Variance of RM NEECs over runs
Fig. 5
Fig. 5
RM & FM EE activity for RMP 3, G σ/G μ = 0.3. Top left panel: 2PC projection of NEECs of RM (blue) and FM (red) runs. Three RM runs (green, labels a, b, c) and three FM runs (labels A, B, C) are selected. Top right panel: matrix of distances between these six NEECs. Remaining panels: EE rasters for RM runs a-c (left column) and FM runs A–C (right column). FM run ’C’ is the run shown in more detail in Fig. 3
Fig. 6
Fig. 6
Relationship between EE activity and the activity-level dependent family of ECGs, G(h¯). Rows 1–5: G σ/G μ = 0.0,0.05,0.1,0.2,0.4 respectively. Columns 1–4: Size(h¯) versus h¯, Frac(h¯) versus h¯, Frac(h¯)(1Size(h¯)) versus h¯, Frac(h¯) versus Size(h¯) respectively
Fig. 7
Fig. 7
a rank correlation between chain activation frequency (D¯) and the h¯circ measure of participation in UOC(h¯) (upper curves) and between D¯ and h¯th (lower curves). b, c: predicted mean number of waves (h¯) versus empirical mean number of waves by (b) peak value of Frac(h¯)×(1Size(h¯)), (c) Frac(h¯)=(1Size(h¯)); identity line, green dashed; regression line, red dotted. For each RMP the sequence of points for G σ/G μ = 0.0,0.05,…0.4 is connected by line segments. The first point (G σ/G μ = 0.0) is close to the identity line and is almost the same for all sequences
Fig. 8
Fig. 8
Condensed ECG (cECG) for h¯=10.6, 2PC projection of NEECs, and selected EE rasters for RMP 3, G σ/G μ = 0.3. Top left panel: As in Fig. 5. Top right panel: cECG. Remaining panels: EE rasters of Fig. 5 with chains colored according the node in cECG to which they belong, and rows permuted so that chains in the same cECG node are adjacent
Fig. 9
Fig. 9
As for Fig. 8 except the ECG is chosen by the criterion Frac(h¯)=1Size(h¯) giving h¯=10.43

References

    1. Abeles M. Local cortical circuits: an electrophysiological study. Berlin: Springer; 1982.
    1. Abeles M, Hayon G, Lehmann D. Modeling compositionality by dynamic binding of synfire chains. Journal of Computational Neuroscience. 2004;17(2):179–201. doi: 10.1023/B:JCNS.0000037682.18051.5f. - DOI - PubMed
    1. Aertsen A, Erb M, Palm G, Schüz A. Coherent assembly dynamics in the cortex: multi-neuron recordings, network simulations and anatomical considerations. In: C. PantevPantev C, Elbert T, Lütkenhöner B, editors. Oscillatory event-related brain dynamics, volume 271 of NATO ASI Series, Series A: Life Sciences. New York: Plenum Press; 1994. pp. 59–83.
    1. Alais D, Blake R. Binocular rivalry and perceptual ambiguity. Cambridge: MIT Press; 2005.
    1. Arnoldi HM, Brauer W. Synchronization without oscillatory neurons. Biological Cybernetics. 1996;74(3):209–223. doi: 10.1007/BF00652222. - DOI - PubMed

Publication types

LinkOut - more resources