. 2015 Nov 12:5:16428.
doi: 10.1038/srep16428.

Determination of RNA polymerase binding surfaces of transcription factors by NMR spectroscopy

Affiliations

Determination of RNA polymerase binding surfaces of transcription factors by NMR spectroscopy

Johanna Drögemüller et al. Sci Rep. .

Abstract

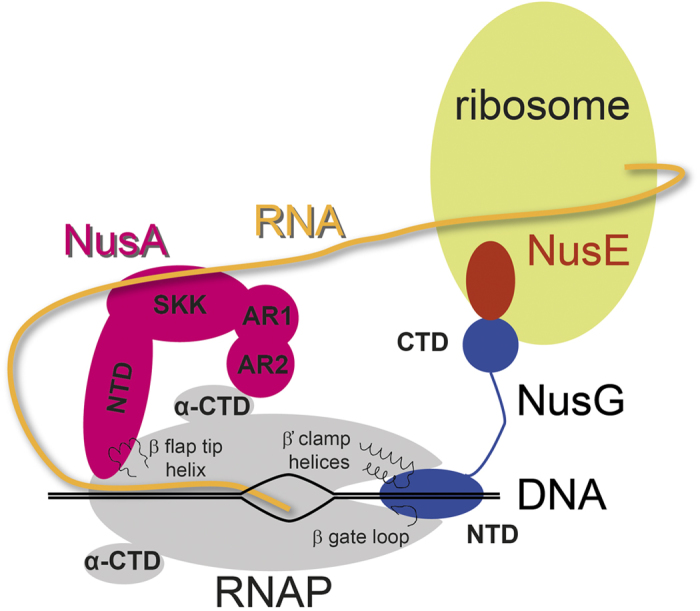
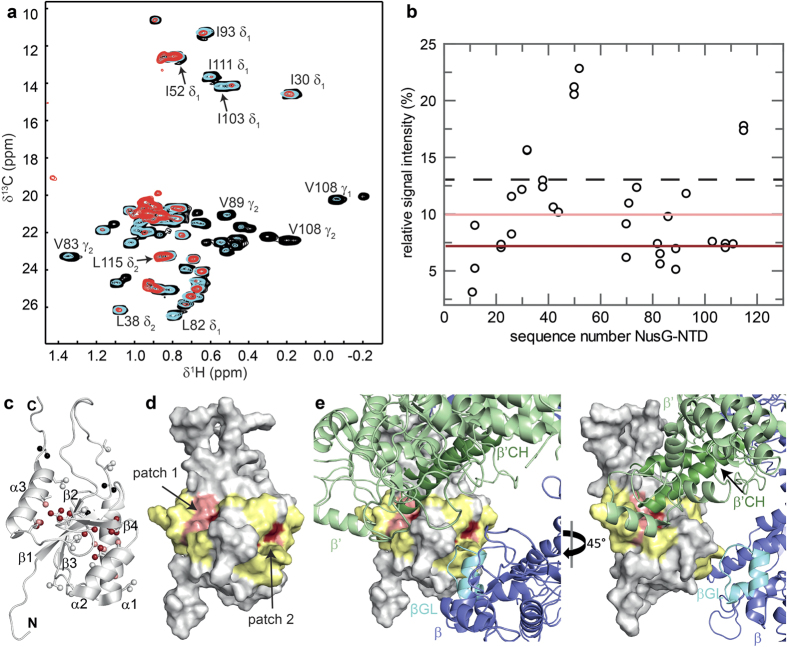
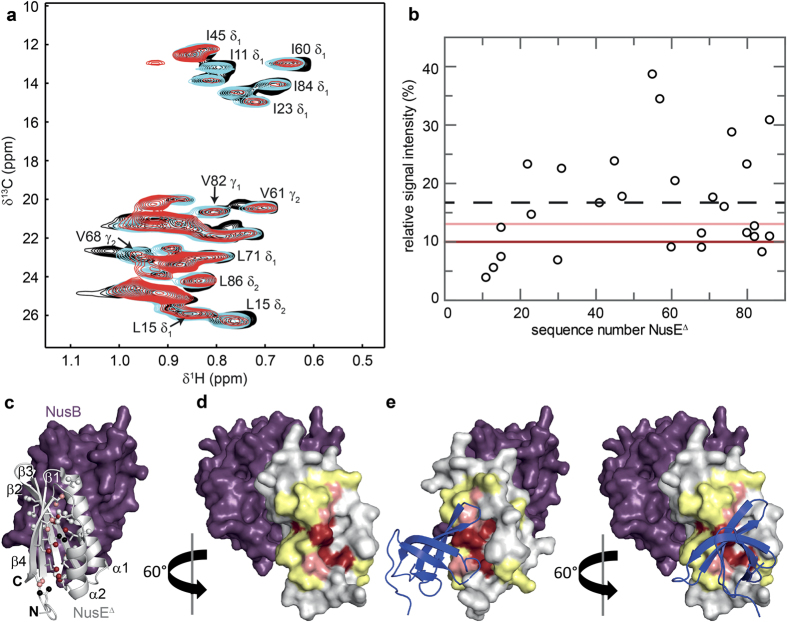
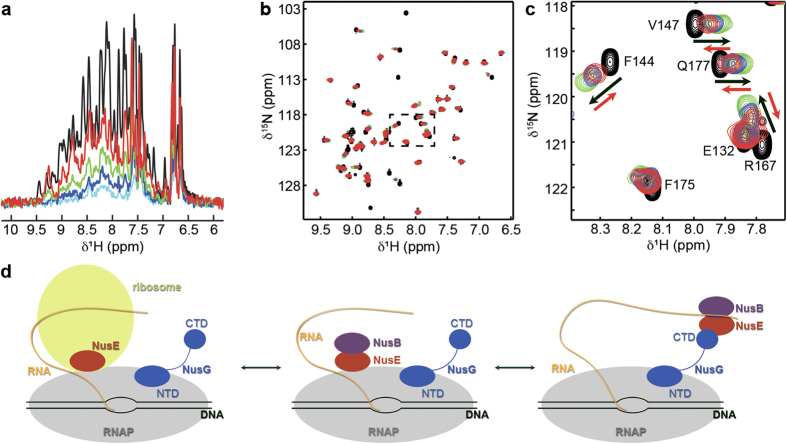
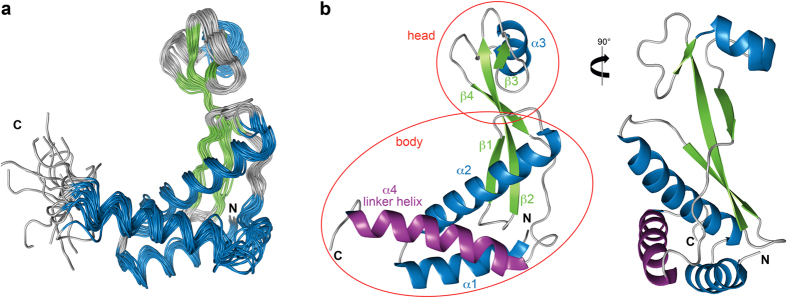
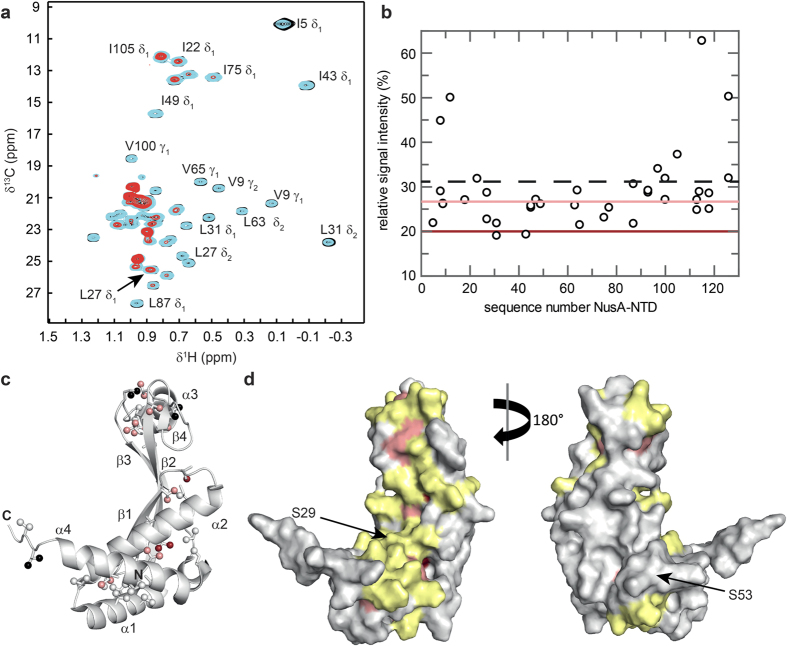
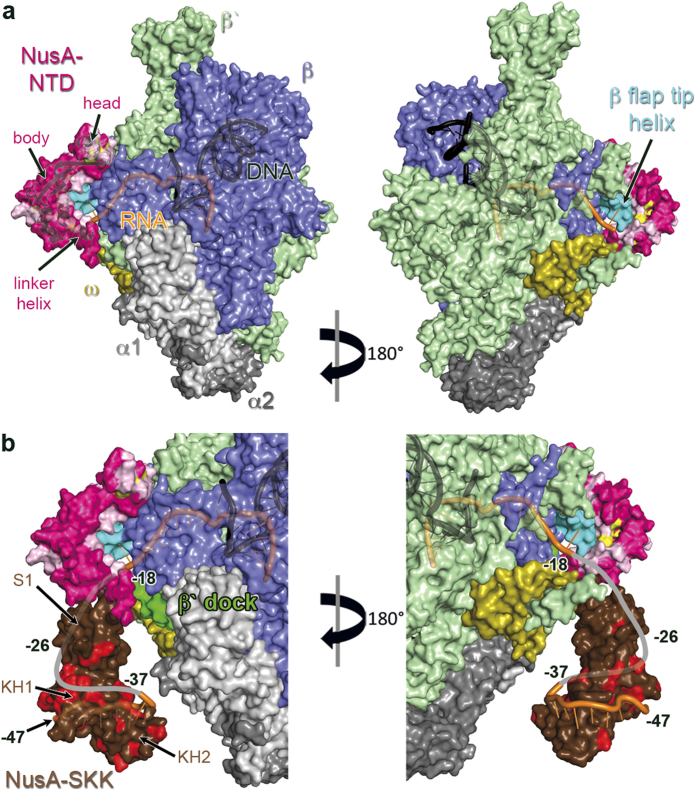
In bacteria, RNA polymerase (RNAP), the central enzyme of transcription, is regulated by N-utilization substance (Nus) transcription factors. Several of these factors interact directly, and only transiently, with RNAP to modulate its function. As details of these interactions are largely unknown, we probed the RNAP binding surfaces of Escherichia coli (E. coli) Nus factors by nuclear magnetic resonance (NMR) spectroscopy. Perdeuterated factors with [(1)H,(13)C]-labeled methyl groups of Val, Leu, and Ile residues were titrated with protonated RNAP. After verification of this approach with the N-terminal domain (NTD) of NusG and RNAP we determined the RNAP binding site of NusE. It overlaps with the NusE interaction surface for the NusG C-terminal domain, indicating that RNAP and NusG compete for NusE and suggesting possible roles for the NusE:RNAP interaction, e.g. in antitermination and direct transcription:translation coupling. We solved the solution structure of NusA-NTD by NMR spectroscopy, identified its RNAP binding site with the same approach we used for NusG-NTD, and here present a detailed model of the NusA-NTD:RNAP:RNA complex.


Figures

Figure 1
Figure 1. Schematic representation of transcription:translation coupling.
NusA, pink, NusE, red; NusG, blue; RNAP, grey; ribosome, light green; DNA, black; RNA, yellow. In RNAP selected structural elements involved in Nus factor binding are indicated.
Figure 2
Figure 2. RNAP binding site of NusG-NTD.
(a) Titration of [I,L,V]-NusG-NTD with protonated RNAP. Methyl-TROSY spectra of [I,L,V]-NusG-NTD in the absence, black, and in the presence of RNAP (1:1 molar ratio, cyan; 1:2 molar ratio, red). Selected signals are labeled. (b) Relative signal intensity of [I,L,V]-NusG-NTD after addition of RNAP in equimolar concentration vs. residue number of NusG-NTD. The dashed black line indicates the average relative signal intensity. Dark red and light red lines indicate the thresholds for strongly affected (55% of the average relative intensity) and slightly affected (75% of the average relative intensity) methyl groups, respectively. (c) Mapping of affected methyl groups onto the NusG-NTD structure (Protein Data Bank (PDB) ID: 2K06, cartoon representation, grey). Ile, Leu, and Val residues are in stick representation with the carbon atoms of their methyl groups as spheres. Strongly affected methyl groups, dark red; slightly affected methyl groups, light red; unaffected methyl groups, grey; unassigned methyl groups, black. Secondary structure elements and termini are labeled. (d) Mapping of affected residues onto the NusG-NTD structure (surface representation). For graphical illustration of the interaction site the complete amino acid was colored as affected in lieu of the methyl group. Colors are as in (c). Two amino acids on either side of affected Ile/Leu/Val residues are highlighted in yellow unless they were unaffected Ile/Leu/Val residues. (e) Model of NusG-NTD as in (d) bound to E. coli RNAP (PDB ID: 4KMU). The model is based on the structure of the Pyrococcus furiosus (P. furiosus) Spt4/5 complex bound to the RNAP clamp domain (PDB ID: 3QQC). NusG-NTD was superposed on Spt5 and RNAP β′ subunit on the clamp domain. As NusG-NTD and RNAP were treated as rigid bodies and no further optimization was carried out some minor clashes occur. β subunit, light blue; β′ subunit, light green; β′CH, dark green; βGL, cyan.
Figure 3
Figure 3. RNAP binding site of NusEΔ.
(a) Titration of [I,L,V]-NusEΔ with protonated RNAP (NusEΔ being in complex with deuterated NusB). Methyl-TROSY spectra in the absence, black, and in the presence of RNAP (1:1 molar ratio, cyan; 1:2 molar ratio, red), with representative signal assignments. (b) Relative [I,L,V]-NusEΔ signal intensity after addition of RNAP in a 1:2 molar ratio vs. amino acid sequence positions of NusEΔ. Dashed black line, average relative signal intensity; dark red and light red lines, thresholds for strongly affected (60% of the average relative intensity) and slightly affected (80% of the average relative intensity) methyl groups, respectively. (c) Mapping of affected methyl groups onto the NusB:NusEΔ complex structure (PDB ID: 3D3B; NusB, purple; NusEΔ, light grey). NusB in surface, NusEΔ in cartoon representation. Ile, Leu, and Val residues in NusEΔ are represented as sticks with the carbon atoms of their methyl groups as spheres. Strongly affected methyl groups, dark red; slightly affected methyl groups, light red; unaffected methyl groups, grey; unassigned methyl groups, black. Secondary structure elements and termini are labeled. (d) Mapping of affected residues onto the NusB:NusEΔ complex structure (surface representation). Colors are as in (c). For graphical illustration of the interaction site the complete amino acid was colored as affected in lieu of the methyl group. Two amino acids on either side of an affected Ile/Leu/Val residue are highlighted in yellow unless they were unaffected Ile/Leu/Val residues. (e) Structure of the NusB:NusEΔ:NusG-CTD complex. The NusEΔ:NusG-CTD complex (PDB ID: 2KVQ, NusG-CTD in blue cartoon representation) was superposed on the NusB:NusEΔ complex from (d).
Figure 4
Figure 4. Competition of RNAP and NusG-CTD for NusE binding.
(a) Displacement of RNAP from NusB:NusEΔ by NusG-CTD. 1D [1H,15N]-HSQC spectra of free NusB:[15N]-NusEΔ, black, NusB:[15N]-NusEΔ in the presence of RNAP in equimolar concentration, light blue, and NusB:[15N]-NusEΔ in the presence of RNAP and NusG-CTD (molar ratio 1:1:1, dark blue; 1:1:3, green; 1:1:10, red). (b) Displacement of NusB:NusEΔ from NusG-CTD by RNAP. 2D [1H,15N]-HSQC spectra of [15N]-NusG-CTD, black, [15N]-NusG-CTD in the presence of NusB:NusEΔ in equimolar concentration, green, and [15N]-NusG-CTD in the presence of NusB:NusEΔ and RNAP (molar ratio 1:1:1, blue; 1:1:3, red). (c) Detail of the rectangular region in (b). Black arrows indicate the chemical shift changes that occur upon addition of NusB:NusEΔ to [15N]-NusG-CTD, red arrows show the changes upon subsequent addition of RNAP. (d) Schematic representation of the potential functions of a direct NusE:RNAP interaction. Color code as in Fig. 1.
Figure 5
Figure 5. Solution structure of NusA-NTDΔ.
(a) Structural ensemble of the 20 accepted lowest energy structures in ribbon representation colored according to secondary structure (α-helices, blue; β-strands, green; loops, grey). (b) Cartoon representation of the calculated structure with the lowest energy. Secondary structure elements are colored as in (a) and labeled. Helix α4 is highlighted in purple, the head and body parts are indicated.
Figure 6
Figure 6. RNAP binding site of NusA-NTDΔ.
(a) Titration of [I,L,V]-NusA-NTDΔ with RNAP. Methyl-TROSY spectra of [I,L,V]-NusA-NTDΔ in the absence, black, and in the presence of RNAP (1:1 molar ratio, cyan; 1:2 molar ratio, red), with assignment of representative signals. (b) Relative [I,L,V]-NusA-NTDΔ signal intensity after addition of RNAP in equimolar concentration vs. amino acid sequence positions of NusA-NTDΔ. Dashed black line, average relative signal intensity; dark red and light red lines, thresholds for strongly affected (65% of the average relative intensity) and slightly affected (85% of the average relative intensity) residues, respectively. (c) Mapping of affected methyl groups onto the NusA-NTDΔ structure. NusA-NTDΔ (grey) in cartoon representation. Ile, Leu, and Val residues are in stick representation with the carbon atoms of their methyl groups as spheres. Strongly affected methyl groups, dark red; slightly affected methyl groups, light red; unaffected methyl groups, grey; unassigned methyl groups, black. (d) Mapping of affected residues onto the NusA-NTDΔ structure (surface representation). For graphical illustration of the interaction site the complete amino acid was colored as affected in lieu of the methyl group. Colors are as in (c). Two amino acids on either side of an affected Ile/Leu/Val residue are highlighted in yellow unless they were unaffected Ile/Leu/Val residues. The positions of Ser29 and Ser53 are marked by black arrows.
Figure 7
Figure 7. Model for the binding of NusA-NTDΔ to elongating RNAP.
(a) NusA-NTDΔ (cartoon and surface representation, pink) is docked to elongating TtRNAP (PDB ID: 2O5I, surface representation). Residues in NusA-NTDΔ that are affected by RNAP binding are highlighted in yellow and two amino acids on either side of an affected Ile/Leu/Val residue are colored in light pink unless they were unaffected Ile/Leu/Val residues. α1, light grey; α2, dark grey; β, blue; β′, pale green; ω, olive; β flap tip helix, teal; RNA, orange; DNA, black. (b) Binding of exiting RNA by NusA. The orientation of NusA-NTDΔ is the same as in (a), the position of TmNusA-SKK was modeled by superposing TmNusA-NTD (PDB ID: 1L2F) on NusA-NTDΔ. RNA was taken from the MtNusA-SKK:RNA complex (PDB ID: 2ASB). Representation of NusA-NTDΔ, TtRNAP and nucleic acids as in (a). The β′ dock domain is highlighted in green. TmNusA-SKK (brown) is in surface representation with residues affected by RNA binding highlighted in red according to Schweimer et al.. The grey line shows a possible path of exiting RNA, the estimated base numbers are indicated.

References

    1. Werner F. & Grohmann D. Evolution of multisubunit RNA polymerases in the three domains of life. Nat. Rev. Microbiol. 9, 85–98 (2011). - PubMed
    1. Ito K., Iwakura Y. & Ishihama A. Biosynthesis of RNA polymerase in Escherichia coli. III. Identification of intermediates in the assembly of RNA polymerase. J. Mol. Biol. 96, 257–271 (1975). - PubMed
    1. Jeon Y. H., Yamazaki T., Otomo T., Ishihama A. & Kyogoku Y. Flexible linker in the RNA polymerase alpha subunit facilitates the independent motion of the C-terminal activator contact domain. J. Mol. Biol. 267, 953–962 (1997). - PubMed
    1. Schweimer K. et al.. NusA interaction with the α-subunit of E. coli RNA Polymerase is via the UP-element site and releases autoinhibition. Structure 19, 945–954 (2011). - PMC - PubMed
    1. Mustaev A. et al.. Modular organization of the catalytic center of RNA polymerase. Proc. Natl. Acad. Sci. USA. 94, 6641–6645 (1997). - PMC - PubMed

Publication types

MeSH terms