

Lifespan and Healthspan: Past, Present, and Promise
- PMID: 26561272
- PMCID: PMC4861644
- DOI: 10.1093/geront/gnv130
Lifespan and Healthspan: Past, Present, and Promise
Abstract
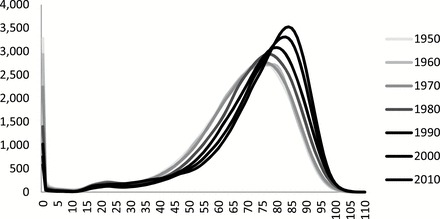
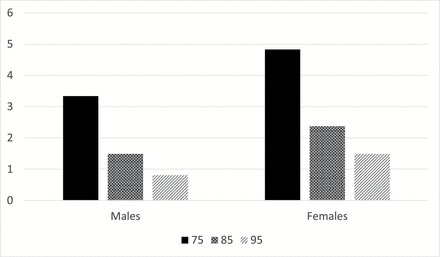
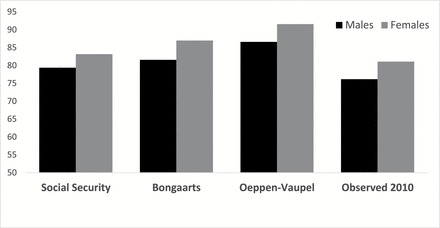
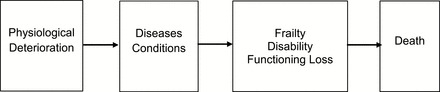
The past century was a period of increasing life expectancy throughout the age range. This resulted in more people living to old age and to spending more years at the older ages. It is likely that increases in life expectancy at older ages will continue, but life expectancy at birth is unlikely to reach levels above 95 unless there is a fundamental change in our ability to delay the aging process. We have yet to experience much compression of morbidity as the age of onset of most health problems has not increased markedly. In recent decades, there have been some reductions in the prevalence of physical disability and dementia. At the same time, the prevalence of disease has increased markedly, in large part due to treatment which extends life for those with disease. Compressing morbidity or increasing the relative healthspan will require "delaying aging" or delaying the physiological change that results in disease and disability. While moving to life expectancies above age 95 and compressing morbidity substantially may require significant scientific breakthroughs; significant improvement in health and increases in life expectancy in the United States could be achieved with behavioral, life style, and policy changes that reduce socioeconomic disparities and allow us to reach the levels of health and life expectancy achieved in peer societies.
Keywords: Compression of morbidity; Delaying aging; Health expectancy; Life expectancy; Trends in morbidity.
© The Author 2015. Published by Oxford University Press on behalf of The Gerontological Society of America. All rights reserved. For permissions, please e-mail: journals.permissions@oup.com.
Figures
References
-
- Alley D. E. Lloyd J., & Shardell M (2010). Can obesity account for cross-national differences in life-expectancy trends? In E. M.Crimmins S. H. Preston, & B.Cohen(Eds.), International differences in mortality at older ages: Dimensions and sources, panel on understanding divergent trends in longevity in high-income countries. Washington, DC: National Academies Press. - PubMed
-
- Arias E. Heron M., & Tejada-Vera B (2013). United States life tables eliminating certain causes of death, 1999–2001. National Vital Statistics Reports, 61. - PubMed
-
- Bell F. C., & Miller M. L (2005). Life tables for the United States social security area 1900–2100. Social Security Administration, Office of the Chief Actuary, SSA Pub. No. 11-11536.
Publication types
MeSH terms
Grants and funding
LinkOut - more resources
Full Text Sources
Other Literature Sources
Medical
Miscellaneous
