. 2015 Nov 24;112(47):E6496-505.
doi: 10.1073/pnas.1519556112. Epub 2015 Nov 11.

Extremely high genetic diversity in a single tumor points to prevalence of non-Darwinian cell evolution

Affiliations

Extremely high genetic diversity in a single tumor points to prevalence of non-Darwinian cell evolution

Shaoping Ling et al. Proc Natl Acad Sci U S A. .

Erratum in

Abstract

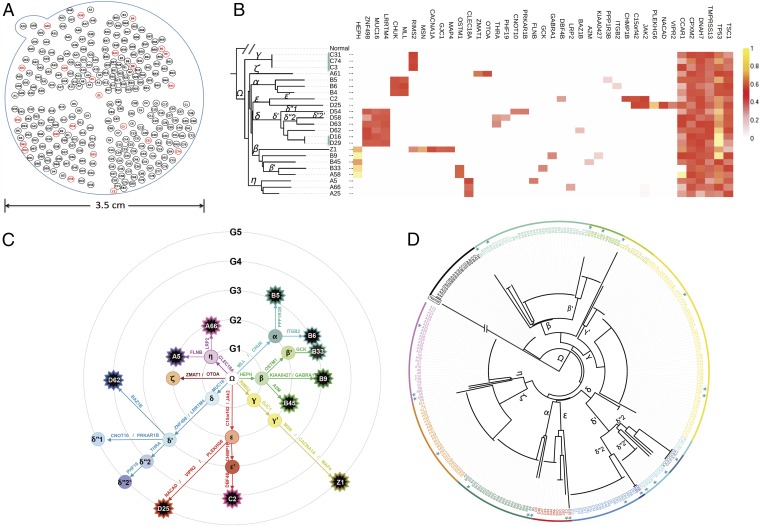
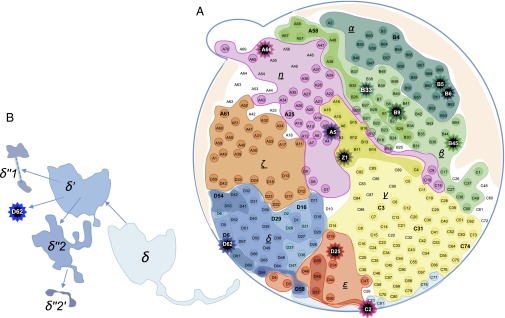
The prevailing view that the evolution of cells in a tumor is driven by Darwinian selection has never been rigorously tested. Because selection greatly affects the level of intratumor genetic diversity, it is important to assess whether intratumor evolution follows the Darwinian or the non-Darwinian mode of evolution. To provide the statistical power, many regions in a single tumor need to be sampled and analyzed much more extensively than has been attempted in previous intratumor studies. Here, from a hepatocellular carcinoma (HCC) tumor, we evaluated multiregional samples from the tumor, using either whole-exome sequencing (WES) (n = 23 samples) or genotyping (n = 286) under both the infinite-site and infinite-allele models of population genetics. In addition to the many single-nucleotide variations (SNVs) present in all samples, there were 35 "polymorphic" SNVs among samples. High genetic diversity was evident as the 23 WES samples defined 20 unique cell clones. With all 286 samples genotyped, clonal diversity agreed well with the non-Darwinian model with no evidence of positive Darwinian selection. Under the non-Darwinian model, MALL (the number of coding region mutations in the entire tumor) was estimated to be greater than 100 million in this tumor. DNA sequences reveal local diversities in small patches of cells and validate the estimation. In contrast, the genetic diversity under a Darwinian model would generally be orders of magnitude smaller. Because the level of genetic diversity will have implications on therapeutic resistance, non-Darwinian evolution should be heeded in cancer treatments even for microscopic tumors.

Keywords: cancer evolution; genetic diversity; intratumor heterogeneity; natural selection; neutral evolution.


Conflict of interest statement

The authors declare no conflict of interest.

Figures

Fig. 1.
Fig. 1.
Sampling scheme and clonal genealogy of HCC-15. (A) Samples were taken from a 1-mm-thick slice cut through the middle of a HCC tumor, 3.5 cm in diameter. Of the 286 samples, 23 were subjected to whole-exome sequencing (red numbers) and the rest (black numbers) were used in genotyping for mutations discovered in sequencing (Materials and Methods, sections 1–5). The numbers correspond with those of Fig. 2. Across the sequenced samples, the average read depth was 74.4× (Dataset S1). On average, these samples contained 85% cancerous cells estimated by ABSOLUTE (52). This level of purity is consistent with previous reports regarding hepatic tumor samples (12), especially when the sample volumes are small (∼20,000 cells). Pathology reports, when available for the matched HCC samples, generally agreed with the purity estimates. (B) All 35 polymorphic nonsynonymous mutations in the sequenced samples are shown in the heat map, which depicts the observed frequencies (from 0 in white to 1 in yellow) with mutation names at the top of the map. Each row presents the mutations in a sequenced sample. Far Right shows six fixed mutations that are potential drivers. Left shows the genealogy of the 24 samples. Only two clones, indicated by blue bars, are represented by more than one sample. (C) The genealogy of clones arranged to reflect their spatial relationships. The ancestral clone, , is in the middle and the descendant clones radiate outward. These clones are arranged on six rings with each outer ring having one more nonsynonymous mutation (indicated) than its interior neighbor. Each star symbol represents a singleton clone. (D) The expanded genealogy that includes all 286 samples. The blue stars designate the sequenced samples.
Fig. S1.
Fig. S1.
Sample collection with honeycomb-like microdissection. The tumor tissues were embedded in optimal cutting temperature (OCT) compound and sliced into 1-mm-thick pieces. One 1-mm-thick slice was subjected to high-density microdissection, using the Harris Micropunch. In total, the slice yielded 286 microsections, including one in the middle of the slice (Z1), and 60–80 microsections in each of the four quadrants (AD). All sample IDs were marked, indicating their position in the tumor. The 23 sequenced samples were marked by red circles.
Fig. S2.
Fig. S2.
Estimated number of cells in microdissected tissues. The x axis represents the samples; the y axis is the estimated number of cells based on the amount of DNA extracted from each of (A) 23 whole-exome sequenced samples and (B) 286 genotyped samples.
Fig. S3.
Fig. S3.
The chromatograms of Sanger sequencing for SNV validation. The boxes indicate the mutations. (A–G) Polymorphic SNVs. (H–K) Fixed SNVs that were not detected from the exome sequencing data in a few samples due to low coverage at the regions. (A) B5-specific A to T on PPP1R3B; (B) D62-specific C to T on BAZ1B; (C) A5-specific G to C on FLNB; (D) A66-specific T to A on LRP2; (E) B45-specific C to A on A2M; (F) B33-specific G to A on GSK; (G) B6-specific A to G on ITGB2; (H) C31 has the T to A mutation on DSCAM; (I) C31 has the A to T mutation on ENPP3; (J) C31 has the A to T mutation on COL21A1; and (K) B4 has the G to A mutation on HYDIN.
Fig. S4.
Fig. S4.
Identification of fixed and polymorphic mutations. A total of 269 putative SNVs were found from the 23 sequenced tumor sections. Diamond, 3 SNVs were randomly chosen for validation; cross-star and star, these SNVs were chosen for validation in the whole-exome sequencing (WES) samples where they were missing, usually due to low read depth. These 269 SNVs are divided into 209 fixed and 38 polymorphic mutations. In addition, 22 SNVs are possibly fixed but have been lost occasionally (i.e., LOH in CNA regions; Materials and Methods, section 4) and 3 SNVs are possibly polymorphic but could not be reliably confirmed by Sequenom across samples due to PCR difficulties.
Fig. S5.
Fig. S5.
The somatic mutation pattern of mutated genes of HCC-15 in 1,363 patients with gastrointestinal cancer. (A) The mutation pattern of fixed and polymorphic mutations of HCC-15 in 1,363 patients with gastrointestinal cancer. FGME is the fold of gene coding mutation enrichment. RA2S is the ratio of the number of nonsynonymous to the number of synonymous mutations. FGME and RA2S were calculated from all 460,967 somatic mutations in 1,363 patients with gastrointestinal cancer. (B) The occurrence rate of six putative driver genes of HCC-15 in 1,363 patients with gastrointestinal cancer, including 202 liver hepatocellular carcinomas (LIHC), 183 esophageal carcinomas (ESCA), 288 stomach adenocarcinomas (STAD), 220 colon adenocarcinomas (COAD), 81 rectum adenocarcinomas (READ), and 147 pancreatic adenocarcinomas (PAAD) from TCGA datasets and 242 hapatocellular carcinomas in Schulze et al. (32) (HCC-NG3252), respectively.
Fig. 2.
Fig. 2.
Map of the mutation clones of HCC-15. A mutation clone is the aggregate of all samples carrying that mutation (main text). Hence, subclones (with increasingly darker hues) are nested within their parent clones. (A) Each star symbol indicates a singleton clone, represented by one sample. The clonal boundaries are delineated by the genotypes of all 286 samples. Many samples straddle two clones (including A3, B17, B19, B20, C78, D6, D9, and Z1). In this “sectoring” pattern of growth, δ′ grew outward from δ and, subsequently, δ′′s (−1, −2) grew outward from δ′. Note that tumors grew in three-dimensional (3D) space but the observations made were on a two-dimensional (2D) plane. This was apparent in the “northeast” direction, along which both the α and β clones were extending from the interior toward the periphery. It appears that α grew above or below β in their expansion toward the periphery. (B) The δ lineage clones are pulled out to display the overlaying pattern of mutation clones. The clonal map was also used to compute the mutation frequency spectrum, ξi, which is the number of sites where the frequency of the mutation was between (i − 1)/23 and i/23 from the 286 samples. We kept the number of frequency bins at 23 because the mutations discovered remained based on the initial 23 samples. The spectrum, as given in the text, is [ξi = 26, 7, 1, 1, 0, 0, …] for i = 1–22 (Materials and Methods, section 9 and Dataset S8).
Fig. S6.
Fig. S6.
Cumulative distribution of Max(k) based on 10,000 times of simulation, for k = 1–4. Max(k) measures the average frequency of the most common k mutations (details in Materials and Methods, section 14).
Fig. 3.
Fig. 3.
Estimated mutation frequency spectrum in the entire HCC-15 tumor. Four estimates assuming different modes of population growth to NT = 106 cells are given (Materials and Methods, sections 10 and 12–14), all within the same order of magnitude of 105 mutations. (i) Mmin, the lowest possible estimate of MALL, is (NT – 1)u (Materials and Methods, section 12). It is here simulated in populations that grow on the periphery, but the interior cells neither divide nor die. (ii) Meq is the estimate of the total diversity assuming that the population has remained at a constant size, equivalent to the long-term average of nonconstant populations. Based on the standard population genetic formulas for constant populations (2, 3), the higher-frequency bins tend to be overestimated and lower-frequency ones underestimated. Overall, Meq would be an underestimation (details in Materials and Methods, sections 12–14). (iii) Mexp is obtained for populations that have grown exponentially from a single cell with the cell birth rate being larger than the death rate (Eq. 2 and Materials and Methods, section 12). (iv) M3D is for the 3D cell population that grows on the periphery with frequent cell turnover in the interior (Materials and Methods, section 14).
Fig. 4.
Fig. 4.
Simulated vs. observed fine-scale diversity in HCC-15. (A–C) Simulated clonal diversity at three levels of resolution. Adjacent clones are differentiated by different colors but nonneighbors often have to be depicted by the same color. Neighboring clones usually differ by one to two coding mutations. The three panels zoom in with finer resolution. The axis labels are the numbers of cells. The minimal clone sizes to be displayed are 50,000, 4,000, and 100 cells in A–C. The mutation rate is u = 0.03 in coding regions and NT = 1.15 × 10⁹. The simulations are done in the 3D space (Materials and Methods, section 14) and samples are taken from a 2D plane cut through the middle as in the actual sampling. Note that clones sometimes go around one another in the third dimension. The simulated A and the observed Fig. 2 are roughly in the same scale. (D) Observed local diversity. From each of the 23 WES samples with an average read depth of ∼75×, the equivalents of 37–38 random cells are sequenced. The mean numbers of mutations in each size bin (ranging from 1 to 40 cells in increments of 5) as well as the SDs across the 23 samples are given. The simulated numbers when 40 cells are sampled from the equivalents of C are also shown. The agreements between the observed and simulated mutation numbers are generally good, except in the smallest-size bin of one to five reads where sequencing errors are high.
Fig. S7.
Fig. S7.
Schematic overview of the library preparation using in-vitro transposition. The EZ-Tn5 transposase mediates the fragmentation of double-stranded DNA and simultaneously ligates the DNA fragments with synthetic oligonucleotides including a unique DNA identity (UID) plus sample barcode plus sequencing adapters. The procedure includes (1) the assembly of a transposase complex (2), DNA fragmentation, and (3) library amplification. After purification, the library is ready for sequencing or whole-exome capture. Dark blue, genomic DNA; light blue/orange, partial sequencing primer; purple/pink, PCR primers and sequencing platform adapters; green, UID of 8-bp random oligonucleotides; gray hexagon, transposon; and gray triangles, 6-bp sample barcode.
Fig. S8.
Fig. S8.
Posterior histograms of parameters by ABC inference. (A) u, mutation rate per cell division in the coding region; (B) Nτ, ancestral population size during the growth of HCC-15; (C) b, the probability that a cell has two offspring in each generation in the discrete-time branching process. The exponential growth rate r = ln(2b). The posterior means are u = 0.093, Nτ = 1,585, and b = 0.627 [thus r = ln(2b) = 0.226]. The red lines indicate the mean values.
Fig. S9.
Fig. S9.
The number of mutations M and Meq from simulation of different growth models. M is the number of mutations in a population of size NT = 105 grown from (A) the exponential model, (B) the 2D growth model, and (C) the 3D growth model. Meq is the equilibrium number of mutations formulated as θ ln(NT). θ is the mutation parameter that was estimated by randomly sampling 23 cells in the population of NT = 105. The method is Ewens’ sampling formula, using the allele frequency spectrum of the 23 sampled cells. Mutation rate in the coding region was set as u = 0.03 per cell division in all simulations.

References

    1. Wen-Hsiung L. 1997. Molecular evolution (Sinauer Associates Inc., Sunderland, MA)
    1. Ewens WJ. Mathematical Population Genetics 1: Theoretical Introduction. Springer; New York: 2010.
    1. Hartl DL, Clark AG. Principle of Population Genetics. 4th Ed Sinauer; Sunderland, MA: 2006.
    1. Nowell PC. The clonal evolution of tumor cell populations. Science. 1976;194(4260):23–28. - PubMed
    1. Maley CC, et al. Genetic clonal diversity predicts progression to esophageal adenocarcinoma. Nat Genet. 2006;38(4):468–473. - PubMed

Publication types

MeSH terms