Intracellular Phosphate Dynamics in Muscle Measured by Magnetic Resonance Spectroscopy during Hemodialysis
- PMID: 26561642
- PMCID: PMC4926979
- DOI: 10.1681/ASN.2015050546
Intracellular Phosphate Dynamics in Muscle Measured by Magnetic Resonance Spectroscopy during Hemodialysis
Abstract
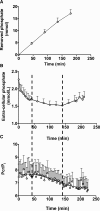
Of the 600-700 mg inorganic phosphate (Pi) removed during a 4-hour hemodialysis session, a maximum of 10% may be extracted from the extracellular space. The origin of the other 90% of removed phosphate is unknown. This study tested the hypothesis that the main source of phosphate removed during hemodialysis is the intracellular compartment. Six binephrectomized pigs each underwent one 3-hour hemodialysis session, during which the extracorporeal circulation blood flow was maintained between 100 and 150 ml/min. To determine in vivo phosphate metabolism, we performed phosphorous ((31)P) magnetic resonance spectroscopy using a 1.5-Tesla system and a surface coil placed over the gluteal muscle region. (31)P magnetic resonance spectra (repetition time =10 s; echo time =0.35 ms) were acquired every 160 seconds before, during, and after dialysis. During the dialysis sessions, plasma phosphate concentrations decreased rapidly (-30.4 %; P=0.003) and then, plateaued before increasing approximately 30 minutes before the end of the sessions; 16 mmol phosphate was removed in each session. When extracellular phosphate levels plateaued, intracellular Pi content increased significantly (11%; P<0.001). Moreover, βATP decreased significantly (P<0.001); however, calcium levels remained balanced. Results of this study show that intracellular Pi is the source of Pi removed during dialysis. The intracellular Pi increase may reflect cellular stress induced by hemodialysis and/or strong intracellular phosphate regulation.
Keywords: chronic dialysis; hyperphosphatemia; intracellular pH; intracellular signal; ion transport; phosphate uptake.
Copyright © 2016 by the American Society of Nephrology.
Figures


References
-
- Giachelli CM, Jono S, Shioi A, Nishizawa Y, Mori K, Morii H: Vascular calcification and inorganic phosphate. Am J Kidney Dis 38[Suppl 1]: S34–S37, 2001 - PubMed
-
- Block GA, Klassen PS, Lazarus JM, Ofsthun N, Lowrie EG, Chertow GM: Mineral metabolism, mortality, and morbidity in maintenance hemodialysis. J Am Soc Nephrol 15: 2208–2218, 2004 - PubMed
-
- Go AS, Chertow GM, Fan D, McCulloch CE, Hsu CY: Chronic kidney disease and the risks of death, cardiovascular events, and hospitalization. N Engl J Med 351: 1296–1305, 2004 - PubMed
-
- Chertow GM, Burke SK, Raggi P Treat to Goal Working Group : Sevelamer attenuates the progression of coronary and aortic calcification in hemodialysis patients. Kidney Int 62: 245–252, 2002 - PubMed
-
- Haas T, Hillion D, Dongradi G: Phosphate kinetics in dialysis patients. Nephrol Dial Transplant 6[Suppl 2]: 108–113, 1991 - PubMed
Publication types
MeSH terms
Substances
LinkOut - more resources
Full Text Sources
Medical
Research Materials
Miscellaneous

