. 2015 Nov 12;10(11):e0142273.
doi: 10.1371/journal.pone.0142273. eCollection 2015.

SNPase-ARMS qPCR: Ultrasensitive Mutation-Based Detection of Cell-Free Tumor DNA in Melanoma Patients

Affiliations

SNPase-ARMS qPCR: Ultrasensitive Mutation-Based Detection of Cell-Free Tumor DNA in Melanoma Patients

Julia Stadler et al. PLoS One. .

Abstract

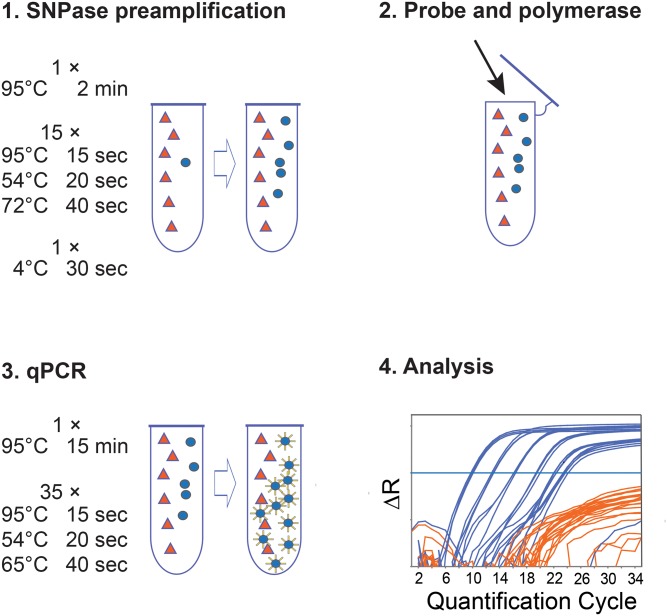
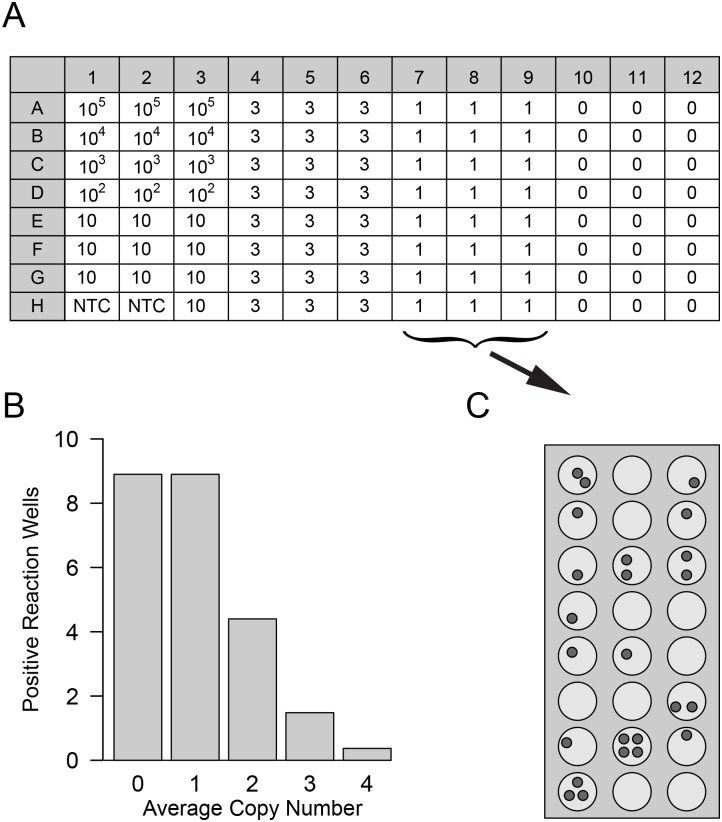
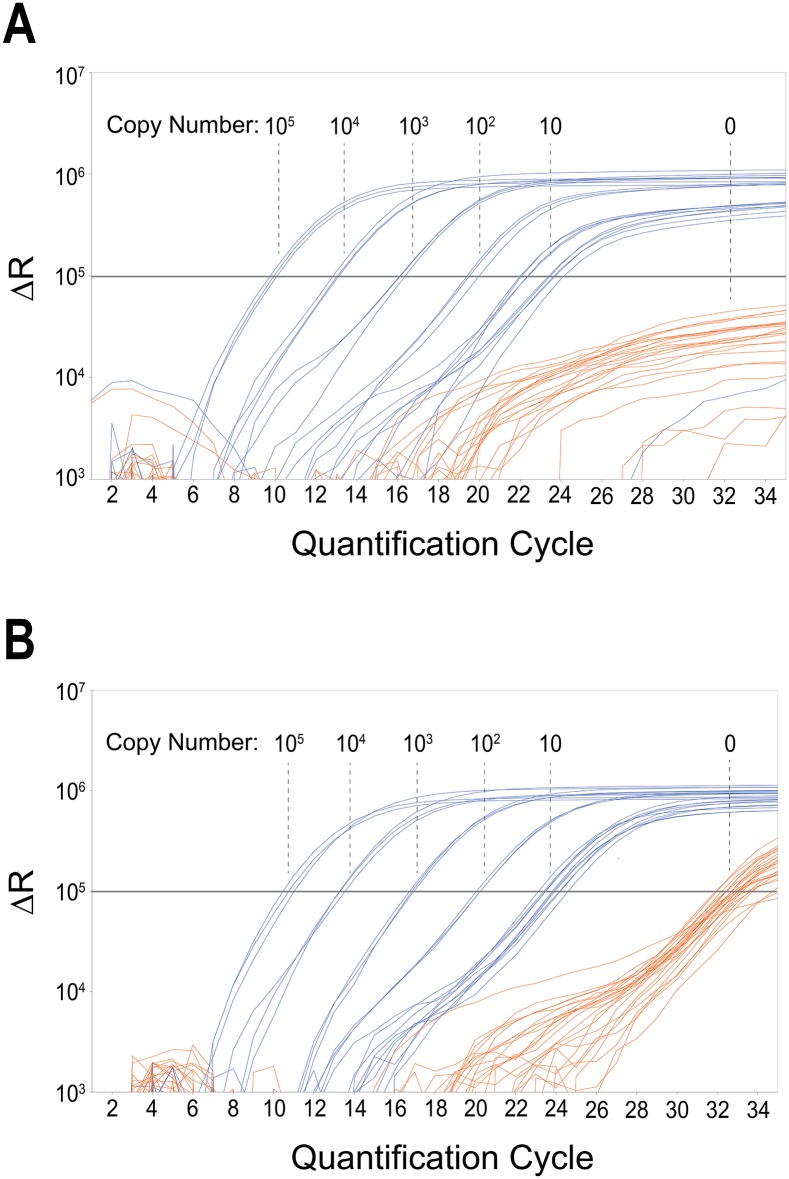
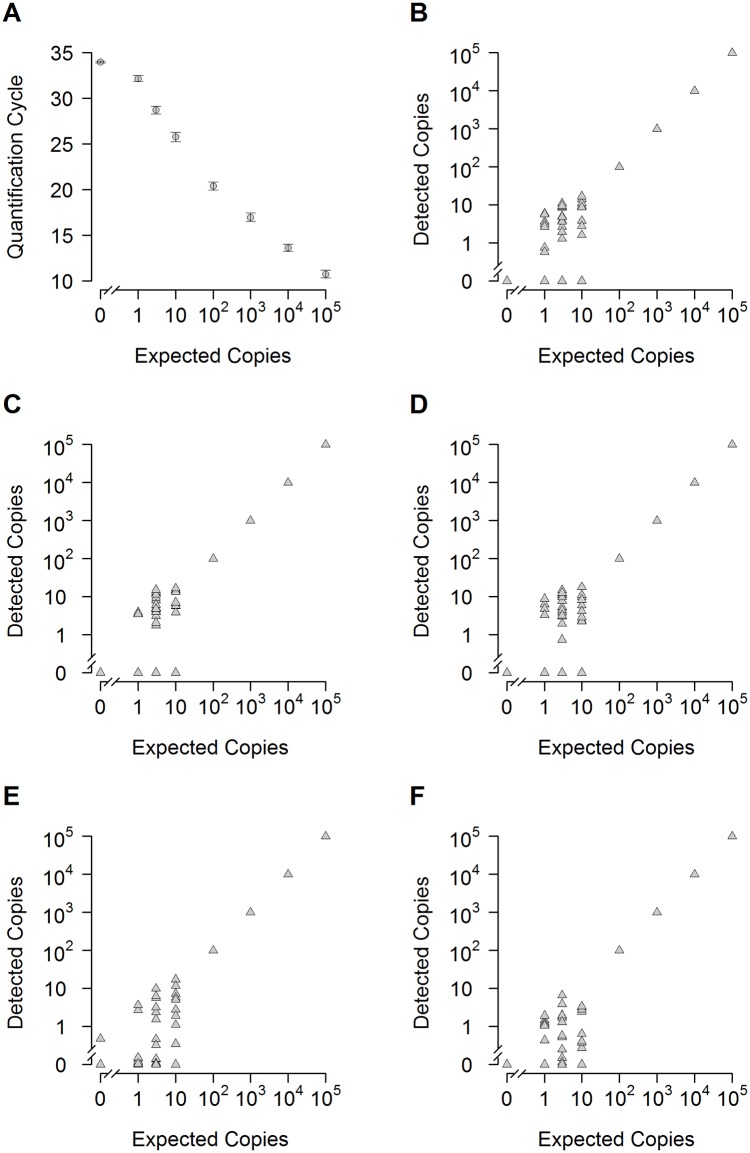
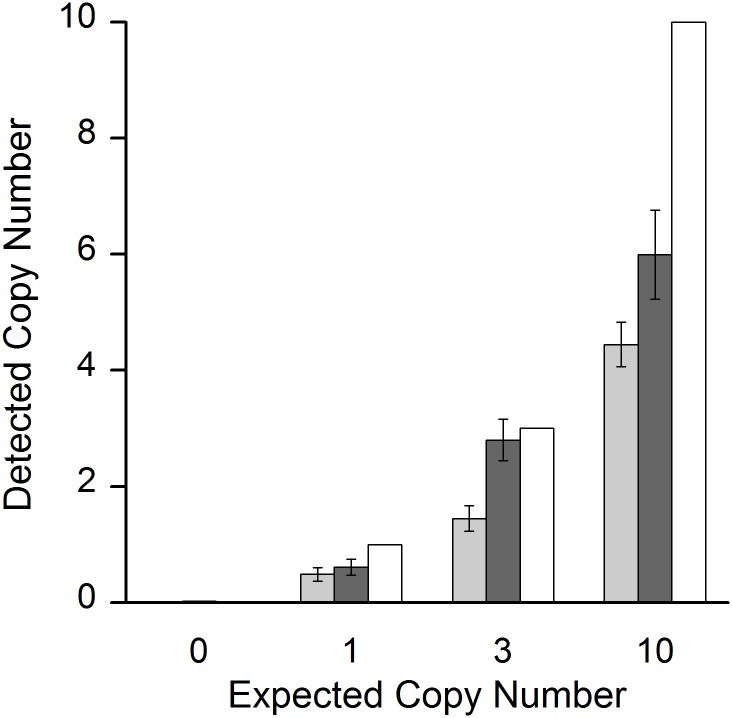
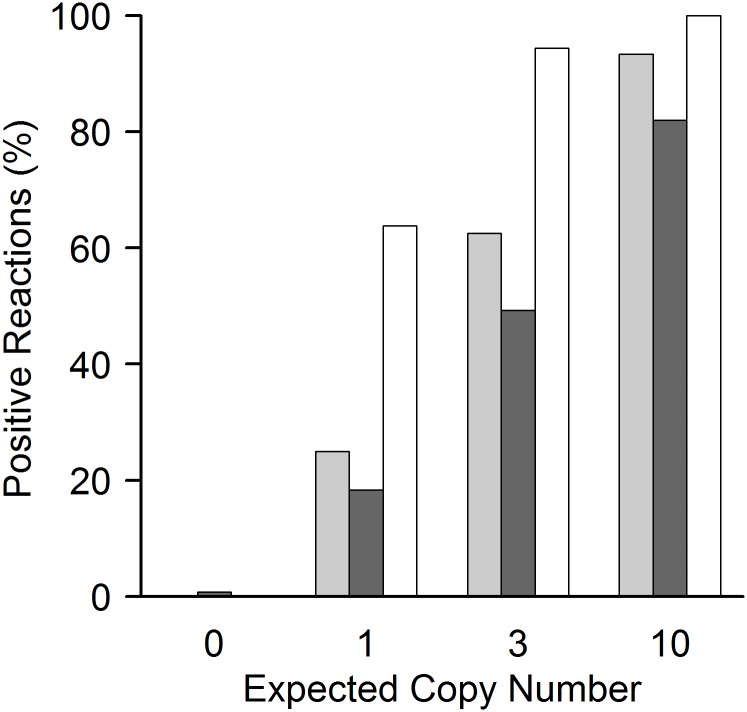
Cell-free circulating tumor DNA in the plasma of cancer patients has become a common point of interest as indicator of therapy options and treatment response in clinical cancer research. Especially patient- and tumor-specific single nucleotide variants that accurately distinguish tumor DNA from wild type DNA are promising targets. The reliable detection and quantification of these single-base DNA variants is technically challenging. Currently, a variety of techniques is applied, with no apparent "gold standard". Here we present a novel qPCR protocol that meets the conditions of extreme sensitivity and specificity that are required for detection and quantification of tumor DNA. By consecutive application of two polymerases, one of them designed for extreme base-specificity, the method reaches unprecedented sensitivity and specificity. Three qPCR assays were tested with spike-in experiments, specific for point mutations BRAF V600E, PTEN T167A and NRAS Q61L of melanoma cell lines. It was possible to detect down to one copy of tumor DNA per reaction (Poisson distribution), at a background of up to 200 000 wild type DNAs. To prove its clinical applicability, the method was successfully tested on a small cohort of BRAF V600E positive melanoma patients.


Conflict of interest statement

Competing Interests: The authors have declared that no competing interests exist.

Figures

Fig 1
Fig 1. Workflow of SNPase-ARMS qPCR.
Fig 1 shows the workflow of SNPase-ARMS qPCR. 1. SNPase preamplification: with the SNPase polymerase, allele-specific primers amplify the target DNA based on the respective single nucleotide variant (SNV) with extreme sensitivity. In 15 PCR cycles the ratio between target (blue circles) and non-target (orange triangles) DNA is changed towards the target DNA. An exemplary temperature protocol for the BRAF V600E assay is shown. The last PCR cycle ends in a 4°C step to inhibit unspecific elongation. The PCR plate is put on ice immediately afterwards, and kept on ice during the next step. 2. Probe and Polymerase: the reaction tube (PCR plate) is opened (preferentially in a separate room to avoid contamination), and 5′ to 3′ exonuclease active polymerase and hydrolysis probe are added. 3. qPCR: in this step, the already preamplified target gene is amplified by the 5′ to 3′ exonuclease active polymerase. The initial step, 95°C for 15 minutes, inhibits the residual SNPase polymerase, and activates the newly added hot-start polymerase. During the following standard qPCR, the sequence-specific hydrolysis probe is cleaved and a fluorescence signal corresponding to the number of cleaved probes is created (symbolized by blue circles with a yellow corona). An exemplary temperature protocol for the BRAF V600E assay is shown. 4. Analysis: the qPCR is evaluated via the amplification plot. Quantification of positive samples is performed with the standard curve method [37] using the ViiA Software, v1.2.4.
Fig 2
Fig 2. Target gene spike-in to test assay sensitivity.
(A) Layout of 96-well microtiter plate to test for assay sensitivity, modified after Rossmanith and Wagner [49]. Spiked-in target gene copy numbers per reaction well are indicated at the respective locations. Wells containing 105 to 100 copies were run in triplicate and used as standards in the analysis; samples of ten copies per well were analyzed in ten reactions; samples of three, one and 0 mutant copies in 24 reactions each. No-template controls (NTC) were included in duplicate. Each plate was repeated at least three times per assay. (B) At very low copy numbers, only part of the reaction wells can contain the target gene due to Poisson distribution. Therefore, even under ideal conditions less than 100% of the reactions can be positive. In this experiment 24 wells per plate were spiked to contain on average one target copy (plate columns 7–9). Due to Poisson distribution, the reaction wells are expected to contain from 0 to four target copies per well (as opposed to a single copy per well which represents the average), indicated on the x-axis of the bar chart. The y-axis indicates the predicted number out of 24 reaction wells that contain the respective copy number shown on the x-axis. This distribution is exemplarily depicted in (C), with small grey circles symbolizing target copies in the respective reaction wells.
Fig 3
Fig 3. Dynamic range of BRAF V600E SNPase-ARMS qPCR.
Exemplary qPCR amplification plots of a serial dilution of 105 to ten BRAF V600E copies in a background of 2 × 10⁵ (A) and 105 (B) wild type BRAF copies (following a 15 cycle SNPase preamplification step) are shown. The respective target-copy number is indicated in the plot. Delta R (y-axis) is plotted against quantification cycle (x-axis). qPCR threshold level is represented by the grey horizontal line. All reactions containing target DNA (blue) are positive and quantifiable with a single negative at ten copies in (A). Negative control samples (orange) show delayed amplification of approximately seven quantification cycles or do not amplify at all. No signal amplification was observed in the NTC sample wells. Results of wells containing three or one target copy are shown in Fig 4 and S3 Fig.
Fig 4
Fig 4. Sensitivity of the BRAF V600E assay against a background of 200 000 wild type copies.
The sensitivity of detection was analyzed with spike-in experiments. DNA from a melanoma cell line harboring the BRAF V600E mutation was spiked against a vast background of DNA from wild type cells (PBMCs). The background DNA equals 2 × 10⁵ copies of wild type BRAF. Number of spiked BRAF V600E copies is shown on the x-axis (logarithmic). (A) Quantification cycle of the qPCR (y-axis) is plotted versus the log concentration of mutant DNA per reaction. Circles depict the average Cq value of multiple reactions of five independent experiments (see (B-F)): 0, 1, 3 copies, n = 120; 10 copies, n = 50; 100-105 copies, n = 15). Error bars depict standard error of the mean. (B-F): Scatter plots of five independent spike-in experiments with the number of detected copies shown on the y-axis (logarithmic). Spiked copies are shown on the x-axis (logarithmic). Triangles show the results of single reaction wells (100-105 copies are defined as standards). Number of reactions per qPCR: 0, 1, 3 copies, n = 24; 10 copies, n = 10; 100-105, n = 3. The assay shows reproducibly high sensitivity and specificity. With a single exception (E) all 120 negative controls reactions were negative.
Fig 5
Fig 5. Quantification of low copy numbers of the BRAF V600E target mutation.
At very low copy numbers, the number of target genes per reaction fluctuates significantly, following Poisson distribution (see also Fig 2). Fig 5 shows the ratio between the average detected copy number (y-axis) v. the expected (= spiked-in) copy number (x-axis and white bars). 0, 1, 3 and 10 BRAF V600E copies were spiked against a background of 105 or 2 × 10⁵ copies of wild type DNA (light and dark grey bars respectively). Error bars depict standard error of the mean. The assay somewhat underrates the average copy number at these low concentrations, shown by the difference between grey and white bars. Nevertheless, it correctly detects and differentiates between 0, 1, 3 and 10 spiked copies both against a background of 105 or 2 × 10⁵ wild type copies with unprecedented specificity (p < 0.001 for all pairwise comparisons). Reaction numbers: 2 × 10⁵ copies: 120 for 0, 1 and 3 copies respectively; n = 50 for 10 copies; 105 copies: 72 for 0, 1 and 3 copies respectively; n = 30 for 10 copies.
Fig 6
Fig 6. Poisson distribution at low copy numbers of the BRAF V600E target mutation.
At very low copy numbers, only part of the reaction wells can contain the target gene due to Poisson distribution. Therefore, even under ideal conditions in less than 100% of the reaction wells target DNA can be detected (see also Fig 2). Fig 6 shows the relation between spiked copies (x-axis) and the percentage of positive reactions (y-axis). White bars represent the percentage of reactions that are expected to yield positive signals following ideal Poisson distribution. Light and dark grey columns represent the percentage of reactions that yielded positive signals for BRAF V600E detection in a background of 105 and 2 × 10⁵ wild type copies respectively. Reaction numbers: see Fig 5. For details on qPCR plate layout see Fig 2. While at 10 copies per reaction the number of positive wells nearly represents ideal conditions, at 1 and 3 copies the assay detects less than expected positive samples. Reduction of positive calls below 10 starting copies is common in PCR based methods, even without the demanding conditions of mutation detection [49]. Under the extreme sensitivity and specificity constraints tested, the performance of this assay, i.e. correct calling of on average one single mutation per reaction in 2 × 10⁵ wild type DNAs, is unprecedented in qPCR. The reduction of positive calls at very low copy number is the trade-off for extreme specificity. As shown, it can be compensated by the possibility to apply multiple wells per run. The BRAF V600E assay correctly detects and differentiates between 0, 1, 3 and 10 spiked copies both against a background of 105 and 2 × 10⁵ wild type copies in our setting (see also Fig 5).

Similar articles

Cited by

References

    1. Jung K, Fleischhacker M, Rabien A. Cell-free DNA in the blood as a solid tumor biomarker—a critical appraisal of the literature. Clin Chim Acta. 2010;411(21–22):1611–24. Epub 2010/08/07. 10.1016/j.cca.2010.07.032 . - DOI - PubMed
    1. Schwarzenbach H, Hoon DS, Pantel K. Cell-free nucleic acids as biomarkers in cancer patients. Nat Rev Cancer. 2011;11(6):426–37. 10.1038/nrc3066 . - DOI - PubMed
    1. Siravegna G, Bardelli A. Genotyping cell-free tumor DNA in the blood to detect residual disease and drug resistance. Genome Biol. 2014;15(8):449 10.1186/s13059-014-0449-4 - DOI - PMC - PubMed
    1. Haber DA, Velculescu VE. Blood-based analyses of cancer: circulating tumor cells and circulating tumor DNA. Cancer Discov. 2014;4(6):650–61. 10.1158/2159-8290.CD-13-1014 - DOI - PMC - PubMed
    1. Diaz LA Jr, Bardelli A. Liquid biopsies: genotyping circulating tumor DNA. J Clin Oncol. 2014;32(6):579–86. 10.1200/JCO.2012.45.2011 . - DOI - PMC - PubMed

Publication types

MeSH terms