. 2015 Nov 12;11(11):e1005257.
doi: 10.1371/journal.ppat.1005257. eCollection 2015.

Diversity of Mycobacterium tuberculosis across Evolutionary Scales

Affiliations

Diversity of Mycobacterium tuberculosis across Evolutionary Scales

Mary B O'Neill et al. PLoS Pathog. .

Abstract

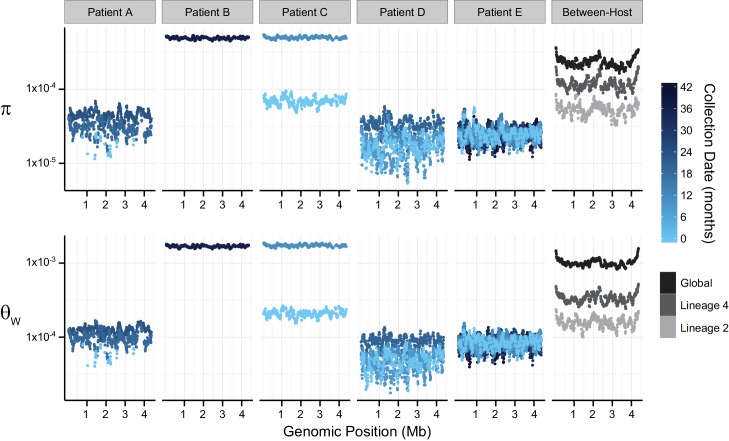
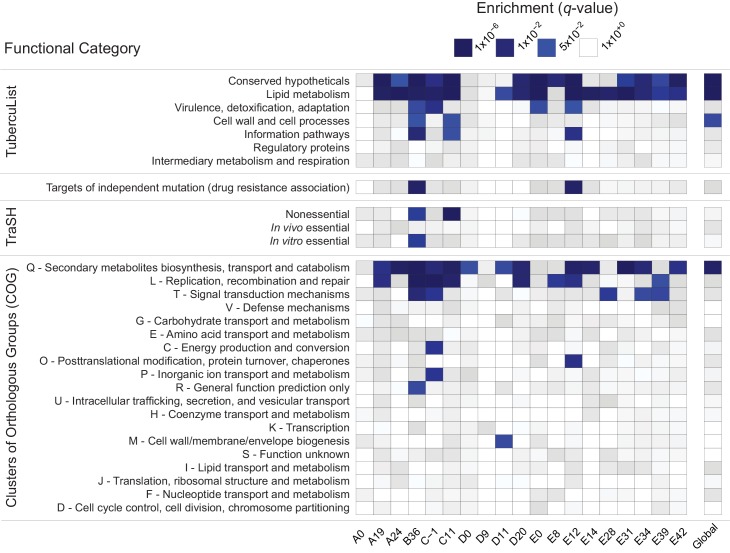
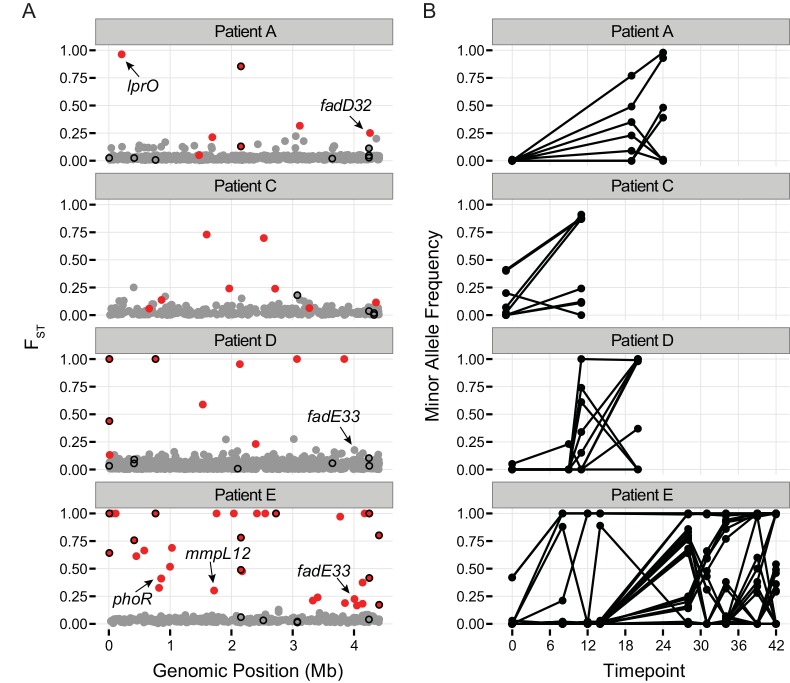
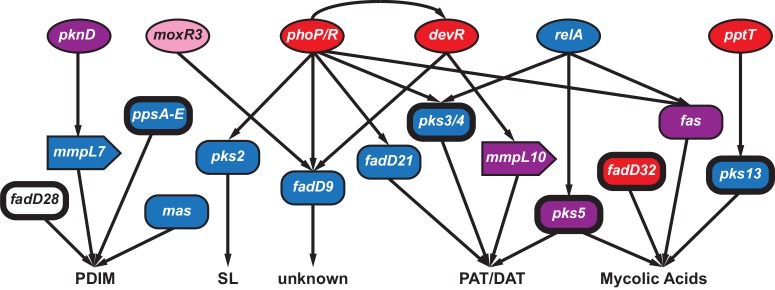
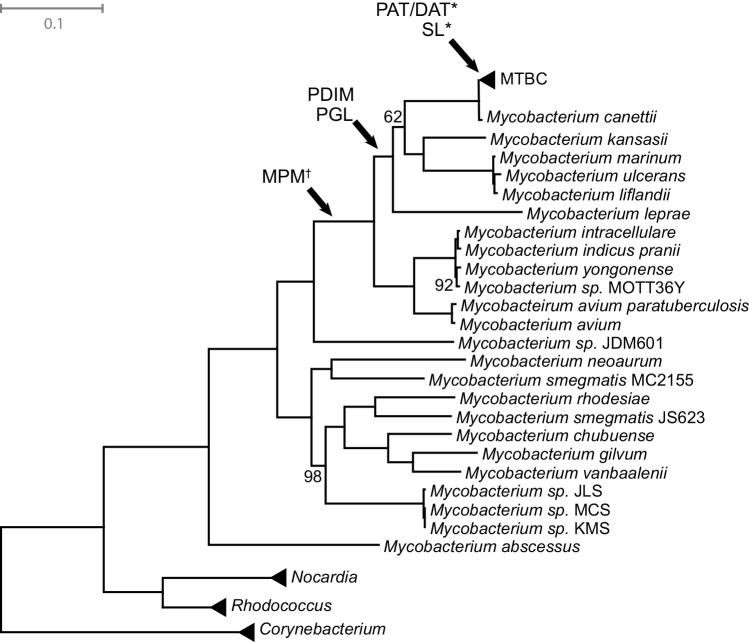
Tuberculosis (TB) is a global public health emergency. Increasingly drug resistant strains of Mycobacterium tuberculosis (M.tb) continue to emerge and spread, highlighting adaptability of this pathogen. Most studies of M.tb evolution have relied on 'between-host' samples, in which each person with TB is represented by a single M.tb isolate. However, individuals with TB commonly harbor populations of M.tb numbering in the billions. Here, we use analyses of M.tb genomic data from within and between hosts to gain insight into influences shaping genetic diversity of this pathogen. We find that the amount of M.tb genetic diversity harbored by individuals with TB can vary dramatically, likely as a function of disease severity. Surprisingly, we did not find an appreciable impact of TB treatment on M.tb diversity. In examining genomic data from M.tb samples within and between hosts with TB, we find that genes involved in the regulation, synthesis, and transportation of immunomodulatory cell envelope lipids appear repeatedly in the extremes of various statistical measures of diversity. Many of these genes have been identified as possible targets of selection in other studies employing different methods and data sets. Taken together, these observations suggest that M.tb cell envelope lipids are targets of selection within hosts. Many of these lipids are specific to pathogenic mycobacteria and, in some cases, human-pathogenic mycobacteria. We speculate that rapid adaptation of cell envelope lipids is facilitated by functional redundancy, flexibility in their metabolism, and their roles mediating interactions with the host.


Conflict of interest statement

The authors have declared that no competing interests exist.

Figures

Fig 1
Fig 1. Patterns of nucleotide diversity (π) and Watterson's theta (ƟW) across the Mycobacterium tuberculosis (M.tb) chromosome.
Sliding-window analyses were performed using 100-Kb windows with a step-size of 10-Kb on uniformly sub-sampled alignments of each sample (50X sequence coverage); plotted values are the mean of each window across 9 replicate sub-samplings. Chromosomal coordinates reflect the genomic positions of the reference strain H37Rv, against which pooled-sequence reads were mapped. Temporal samples of each patient’s M.tb population are colored to reflect the sample collection date as shown in the legend; global and lineage-specific estimates are colored as indicated in the legend.
Fig 2
Fig 2. Enrichment of annotation categories among genes with extreme negative values of Tajima’s D (TD).
Within each sample (labeled at the bottom of the heatmap), gene-wise TD values were compared and the bottom 5% of genes in the distribution were tested for overrepresentation of functional categories using a two-sided Fisher’s exact test. To account for multiple hypothesis testing, a false discovery rate of 5% was used and the resulting q-values are displayed on a continuous scale with varying shades of blue indicating significance at the 0.05 level. The manually curated TubercuList “conserved hypotheticals” and “lipid metabolism” categories [39], as well as the computationally predicted COG:Q “secondary metabolites biosynthesis, transport and catabolism” [40] are notable for their consistent enrichment at both the within- and between-host scales.
Fig 3
Fig 3. Gene-wise estimates of Tajima’s D and π N /πS at the between-host scale.
Each circle represents a gene in the H37Rv genome. π N S values are plotted on a logarithmic (base 2) scale.
Fig 4
Fig 4. Population differentiation between samples.
A.) Pairwise FST of polymorphic sites. Each patient sample was treated as a population and FST was calculated individually for each polymorphic site in a population. Calculations were performed on all polymorphic sites covered by at least 10 reads per sample for which the minor allele was supported by a minimum of 6 reads across all samples from the population (see Methods). Dots show the highest observed FST value for each single nucleotide polymorphism (SNP) across the H37Rv genome. Red color coding indicates allele frequencies changed significantly across the sampling interval (based on a Fisher’s exact test; q-value < 0.01). Genes implicated in drug resistance are outlined in black. Outliers of the FST distribution are likely to be under positive selection, or linked to a mutation under positive selection. B.) Allele frequencies over the course of treatment for SNPs with significant changes in allele frequency (red dots in A).
Fig 5
Fig 5. Connectivity of regulators and targets involved in the synthesis of Mycobacterium tuberculosis immunomodulatory lipids.
Interactions (shown as arrows) among select genes involved in the regulation (circles), synthesis (rectangles) and transport (block arrows) of phthiocerol dimycocerosates (PDIM), sulfolipids (SL), polyacyl trehalose (PAT), diacyl trehalose (DAT), and mycolic acids. The coloring scheme reflects patterns of variation observed at these loci: genes colored red had signatures of positive selection (gene contained an FST outlier and/or was in the 95th percentile of π N S at the between-host scale), blue indicates the gene had extreme Tajima’s D (TD) (5th percentile of between-host TD and/or 5th percentile of within-host TD for ≥ 5 within-host samples), purple genes contained both low TD and signatures of positive selection, while pink indicates\ the gene had evidence of selection against non-synonymous diversity (5th percentile between-host π N S). Genes identified as targets of selection in other studies are indicated with bolded outlines. See discussion in text for more details.
Fig 6
Fig 6. Mycobacteria maximum likelihood tree.
Phylogenetic analysis is based on a core genome alignment of 57 strains (S7 Table). Arrows indicate the probable emergence of specific lipids in the phylogenetic history of Mycobacterium based on previous studies [54,62,79]. *Indicates lipids are only found in M. tuberculosis sensu stricto, not other members of Mycobacterium tuberculosis complex (MTBC). Indicates uncertainty in the placement because lipids of M. sp. JDM501 have not been characterized. Bootstrap values are 100 unless otherwise labeled. Scale bar indicates the mean number of substitutions per site. ABREVIATIONS: PDIM–phthiocerol dimycocerosates; PGL–phenolic glycolipids; SL–sulfolipids; MPM–mannosyl-β-1-phosphomycoketides; PAT–polyacyl-trehalose; DAT–diacyl-trehalose

References

    1. WHO | Global tuberculosis report 2014. In: WHO [Internet]. [cited 6 Jan 2015]. http://www.who.int/tb/publications/global_report/en/
    1. Klopper M, Warren RM, Hayes C, Gey van Pittius NC, Streicher EM, Müller B, et al. Emergence and Spread of Extensively and Totally Drug-Resistant Tuberculosis, South Africa. Emerg Infect Dis. 2013;19: 449–455. 10.3201/EID1903.120246 - DOI - PMC - PubMed
    1. Achtman M. Insights from genomic comparisons of genetically monomorphic bacterial pathogens. Philos Trans R Soc B Biol Sci. 2012;367: 860–867. - PMC - PubMed
    1. Pepperell CS, Casto AM, Kitchen A, Granka JM, Cornejo OE, Holmes EC, et al. The Role of Selection in Shaping Diversity of Natural M. tuberculosis Populations. PLoS Pathog. 2013;9: e1003543 10.1371/journal.ppat.1003543 - DOI - PMC - PubMed
    1. Pepperell C, Hoeppner VH, Lipatov M, Wobeser W, Schoolnik GK, Feldman MW. Bacterial Genetic Signatures of Human Social Phenomena among M. tuberculosis from an Aboriginal Canadian Population. Mol Biol Evol. 2010;27: 427–440. 10.1093/molbev/msp261 - DOI - PMC - PubMed

Publication types

MeSH terms

Substances