Review
. 2016 Jan-Feb;45(1-2):5-31.
doi: 10.1177/0301006615602599. Epub 2015 Sep 21.

Number As a Primary Perceptual Attribute: A Review

Affiliations
Review

Number As a Primary Perceptual Attribute: A Review

Giovanni Anobile et al. Perception. 2016 Jan-Feb.

Abstract

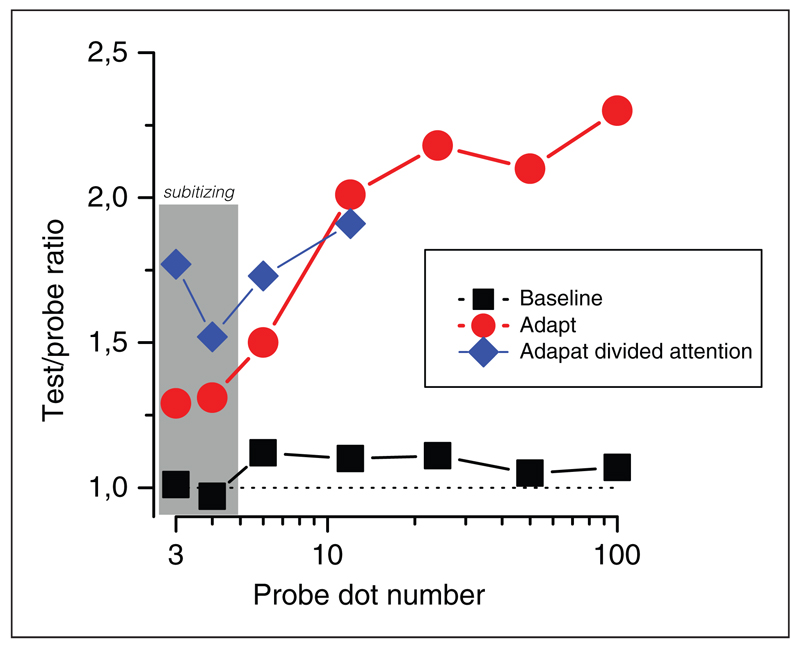
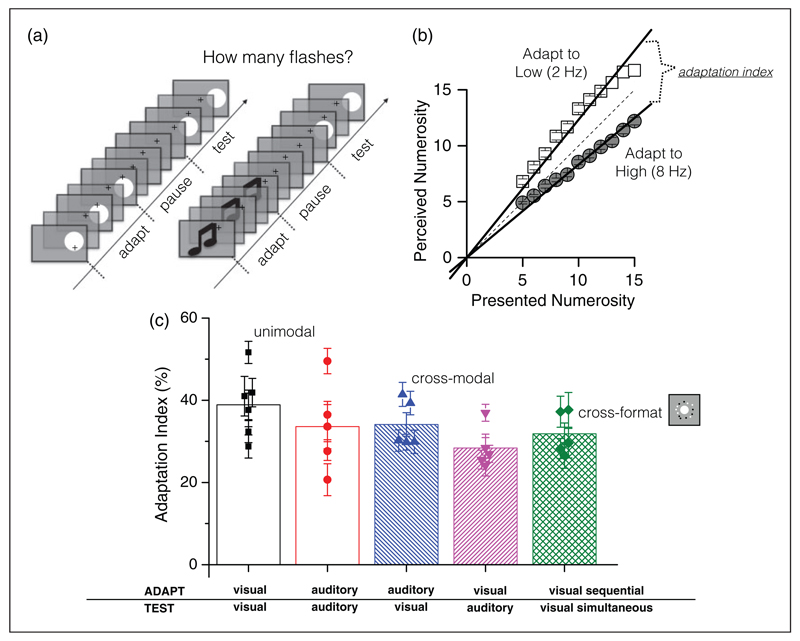
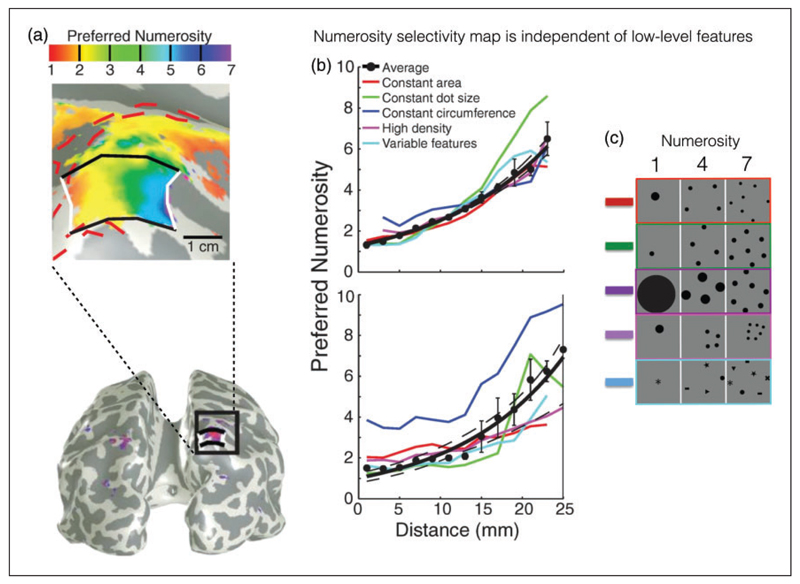
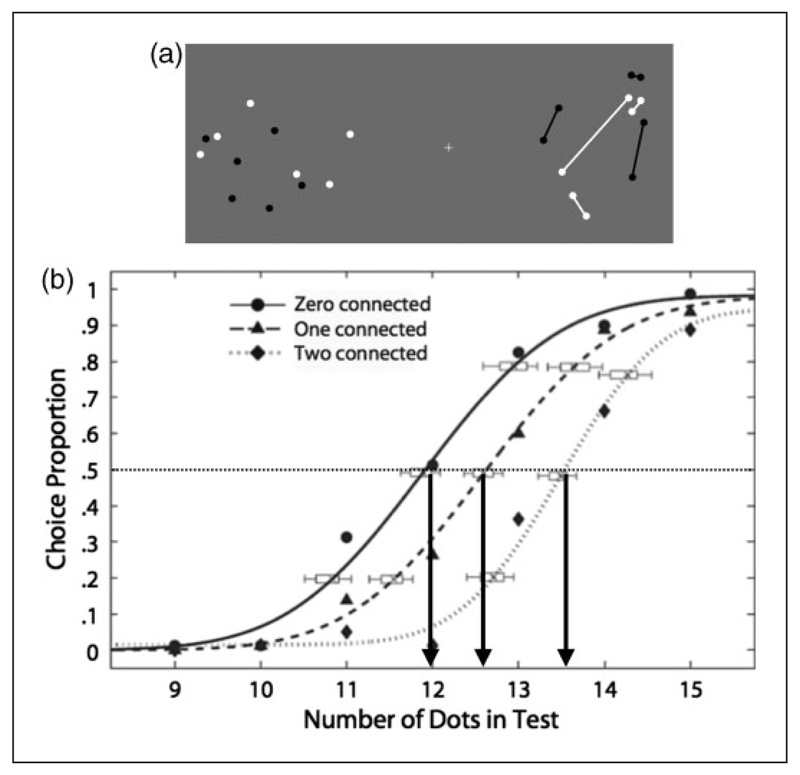
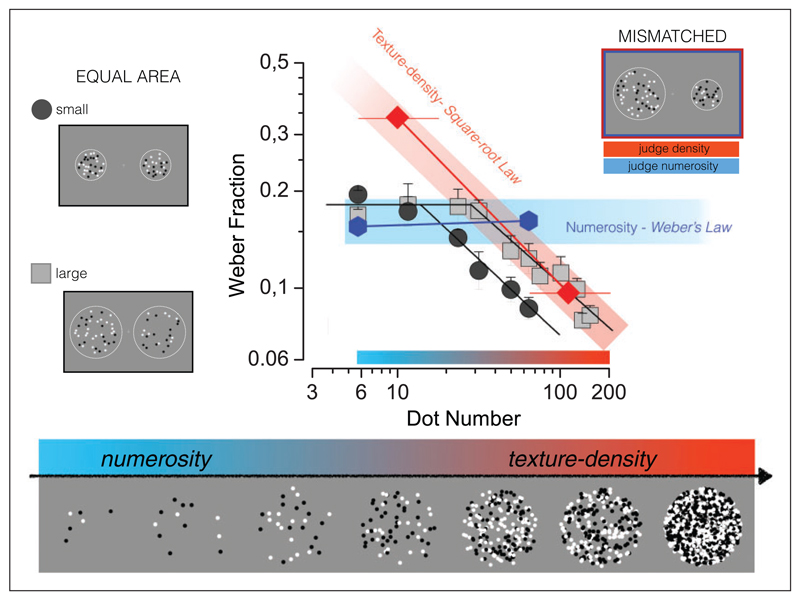
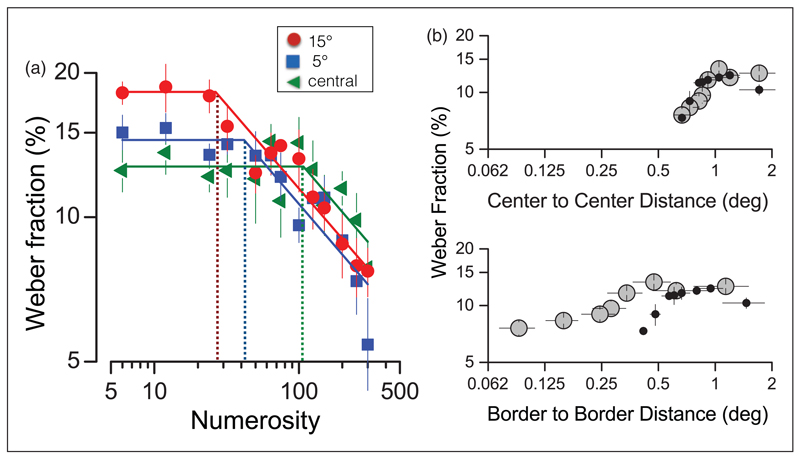
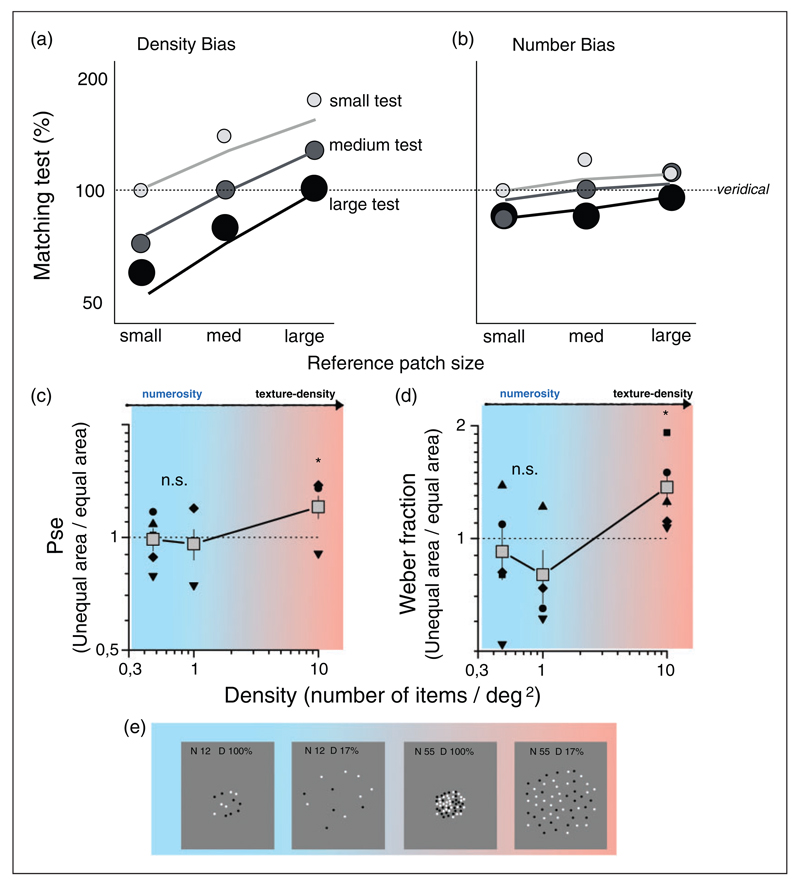
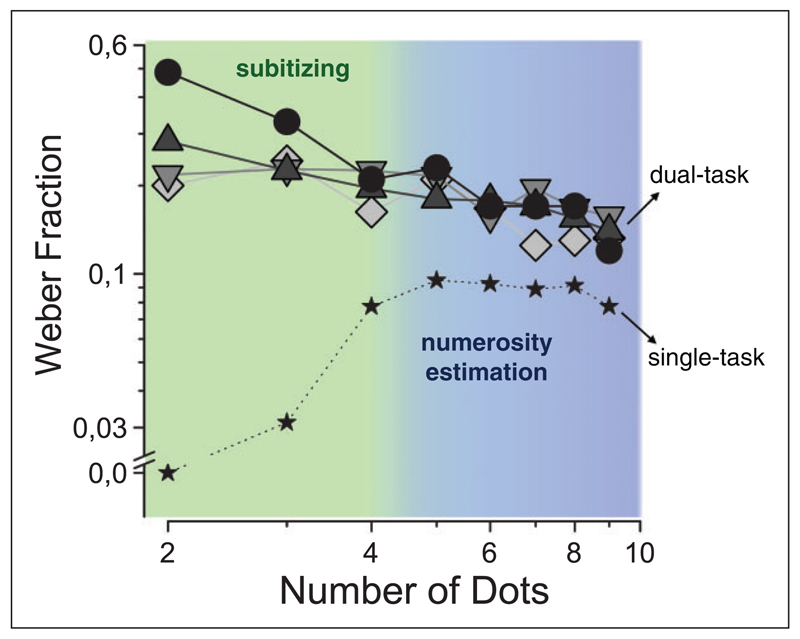
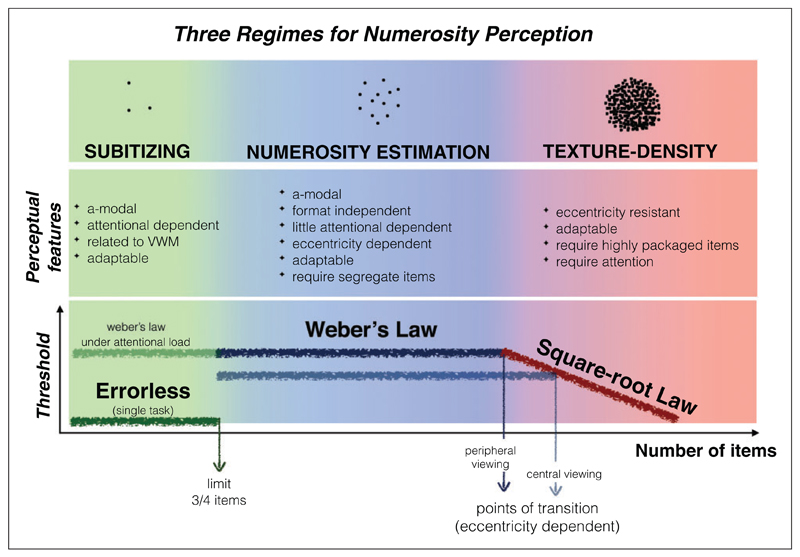
Although humans are the only species to possess language-driven abstract mathematical capacities, we share with many other animals a nonverbal capacity for estimating quantities or numerosity. For some time, researchers have clearly differentiated between small numbers of items--less than about four--referred to as the subitizing range, and larger numbers, where counting or estimation is required. In this review, we examine more recent evidence suggesting a further division, between sets of items greater than the subitizing range, but sparse enough to be individuated as single items; and densely packed stimuli, where they crowd each other into what is better considered as a texture. These two different regimes are psychophysically discriminable in that they follow distinct psychophysical laws and show different dependencies on eccentricity and on luminance levels. But provided the elements are not too crowded (less than about two items per square degree in central vision, less in the periphery), there is little evidence that estimation of numerosity depends on mechanisms responsive to texture. The distinction is important, as the ability to discriminate numerosity, but not texture, correlates with formal maths skills.

Keywords: Numerosity; approximate number system; numerical cognition; subitizing; texture density.


Conflict of interest statement

Declaration of Conflicting Interests The author(s) declared no potential conflicts of interest with respect to the research, authorship, and/or publication of this article.

Figures

Figure I
Figure I. Numerosity adaptation.
Magnitude of adaptation (expressed as a ratio of number of dots in the test patch to that in the probe) as a function of number of dots in the probe. Red circles show standard results with a single task, blue diamonds results when attention was deprived with a demanding conjunction task. Black squares show baseline performance with no adaptation or attentional load. Values above the unity line (dashed) indicate underestimation after adaptation to a high numerosity (400). The gray shading indicates probes in the subitizing range (discussed later). Reproduced with permission from Burr and Ross (2008) and Burr, Anobile, and Turi (2011).
Figure 2
Figure 2. Cross-modal, cross-format numerosity adaptation.
(a) Examples of stimuli for the serial number adaptation, visual unimodal (at left), and auditory-visual cross-modal (at right). (b) Sample results in the visual unimodal adaptation task. Adapting to low numbers (2 Hz, open squares) produces an overestimation of numerosity, and adaption to high numbers (8 Hz, gray circles) and underestimation. Data were well-fitted with linear regressions (lines on the data) constrained to pass throughout zero, and the strength of the adaptation effect (adaptation index) given by the difference in slope of the regression lines. (c) Mean adaptation indexes for the various experimental conditions: uni-modal visual and auditory adaptation; cross-modal auditory-visual and visual-auditory adaptation; and “cross-format” adaptation (adapt to serial presentation, test with simultaneous). Bars show average data, symbols single subject data). Adapted with permission from Arrighi et al. (2014).
Figure 3
Figure 3. Selectivity to numerosity in human parietal cortex.
(a) Example of the stimuli used by Piazza et al. (2004) in the habituation paradigm (habituation stimulus 16 dots and deviants 8 and 24 dots). (b) Activation curves expressed as change in BOLD elicited by deviant stimuli compared with activation induced by habituation stream. (c) Brain regions responding to number change. (d)Habituation paradigm, adapting with 10 dots then testing with standard dot stimuli and with three pairs connected (like Figure 5(a)). When three pairs of dots are connected, the peak in the function is at 13 rather than 10 dots, showing that connectivity reduces effective numerosity in IPS. Adapted with permission from Piazza et al. (2004) and Piazza, Fumarola, Chinello, and Melcher (2011). IPS: intraparietal sulcus.
Figure 4
Figure 4. Topographic representation of numerosity in human parietal cortex.
(a) Spatially organized numerosity map for small numbers of elements (from 1 to 7) in the parietal cortex. Color code reflects brain regions preferentially activated by given numerosities. (b) Progression of numerosity selectivity (dots) as a function of distances from white lines in Figure 4(a). Different line colors refer to separate conditions where low-level features of stimuli were controlled for Figure 4(c). Adapted with permission from Harvey et al. (2013).
Figure 5
Figure 5. Connectedness effect on numerosity perception.
(a) Example of stimuli configuration illustrating the effect of connectedness: The pattern on the right appears less numerous. (b) Sample psychometric functions of one subject from He, Zhang, Zhou, and Chen (2009) showing proportion of choice test stimulus as more numerous then the reference (containing 12 unconnected dots). Test stimuli could contain zero, one, or two pairs of connected dots. The rightward shift of psychometric functions compared with the zero-connected indicates underestimation of the test when dots were connected. Adapted with permission from He, Zhang, Zhou, and Chen (2009).
Figure 6
Figure 6. Different sensory thresholds for numerosity and texture density discrimination.
Weber Fractions as a function of dot number, for two different stimulus areas of test and probe. Dark gray circles refer to test and probe stimuli confined in small circular areas (8° diameter), light gray squares to large areas (14° diameter), for numerosity discriminations. Weber fractions in both areas conditions remain constant up to a critical numerosity, then start to decrease, with a slope of −0.5, consistent with a square-root relationship. The blue hexagons show thresholds for discriminating numerosity in the unequal-area condition, red diamonds density discriminations for unequal areas. Adapted with permission from Anobile et al. (2014).
Figure 7
Figure 7. Transition point between numerosity and texture density.
(a) Weber Fractions for numerosity discrimination of dots patches centered at three different eccentricities (15° red circles, 5° blue squares, central presentation, green triangles). Transition points between numerosity (Weber’s Law, flat zone) and texture-density regime (square-root law, descending zone) depend on eccentricity (dotted lines). (b) Weber fractions for numerosity plotted as a function of average center-to-center inter-dot distance (upper panel) or average border-to-border distance (bottom panel). Large gray-circles refer to stimuli patches comprising large dots (diameter 0.58°), small-black filled symbols to small dots (diameter 0.25°). Adapted with permission from Anobile et al. (2015).
Figure 8
Figure 8. Effect of area mismatching on numerosity discrimination.
(a and b) Biases in the PSE reported by Dakin, Tibber, Greenwood, Kingdom, and Morgan (2011), as a function of reference patch size for three levels of the test sizes (light-gray small, mid-gray medium, and black large) for density (a) and number (b) discrimination. Horizontal dashed lines indicate no bias. The data show clear size-dependent biases in estimation of density and smaller dependence for numerosity. (c and d) Testing the bias at different stimulus densities. (e) Examples of stimuli of different density. Stimuli were presented centered at 13° left and right of central fixation point. The probe numerosity was kept fixed, in separate sessions at N = 6 (0.47 dots/deg2), 12 (0.95 dots/deg2), or 128 (10.18 dots/deg2) dots. Test stimuli varied according subjects’ responses following the QUEST algorithm. In the equal-area condition, probe and test areas were both 113 deg2. In the unequal area, condition probe area was reduced to 12.56 deg2. (c) Accuracy biases expressed as the ratio of PSE measured in the unequal- to the equal-area condition, as a function of density. Values above one indicate overestimation of the larger stimulus. (d) Precision biases measured as the ratio of Weber Fraction measured in the unequal- and equal-area conditions. Values above one indicate worse precision in the area-mismatched conditions. T test reveals statistically significant effect (t(4) = 2.37, p < .05) of mismatch area on both PSE and Weber Fraction only for highest tested density (N = 128, 10.18 dots/deg2). Adapted with permission from Dakin et al. (2011).
Figure 9
Figure 9. Effect of multisensory attention in subitizing and estimation range.
Weber fractions in number estimation (standard deviation divided by physical numerosity) in the single-task (dotted line, small stars) and as a secondary task in divided attention condition. The primary tasks were haptic time bisection (circles), auditory time bisection (diamonds), auditory pitch discrimination (downward triangles), and visual conjunction (upward triangles). Attentional load strongly impairs precision in the subitizing range (4 and below), irrespective of the modality or type of distractor task. Adapted with permission from Anobile et al. (2012).
Figure 10
Figure 10. Summary of psychophysical characteristics of numerosity judgments in the three numerosity regimes/ranges.
Main characteristics or properties of numerosity judgments are listed in middle row: Weber fractions as a function of numerosity are sketched in the bottom row.

References

    1. Alais D, Morrone C, Burr D. Separate attentional resources for vision and audition. Proceedings of Bioogical Sciences. 2006;273:1339–1345. doi: 10.1098/rspb.2005.3420. - DOI - PMC - PubMed
    1. Allik J, Tuulmets T. Occupancy model of perceived numerosity. Perception & Psychophysics. 1991;49:303–314. - PubMed
    1. Anderson ML, Penner-Wilger M. Neural reuse in the evolution and development of the brain: Evidence for developmental homology? Developmental Psychobiology. 2013;55:42–51. doi: 10.1002/Dev.21055. - DOI - PubMed
    1. Anobile G, Cicchini GM, Burr DC. Separate mechanisms for perception of numerosity and density. Psychological Science. 2014;25:265–270. doi: 10.1177/0956797613501520. - DOI - PubMed
    1. Anobile G, Stievano P, Burr DC. Visual sustained attention and numerosity sensitivity correlate with math achievement in children. Journal of Experimental Child Psychology. 2013;116:380–391. doi: 10.1016/j.jecp.2013.06.006. - DOI - PubMed

Publication types

LinkOut - more resources