

In vivo assessment of optical properties of melanocytic skin lesions and differentiation of melanoma from non-malignant lesions by high-definition optical coherence tomography
- PMID: 26563265
- PMCID: PMC4713458
- DOI: 10.1007/s00403-015-1608-5
In vivo assessment of optical properties of melanocytic skin lesions and differentiation of melanoma from non-malignant lesions by high-definition optical coherence tomography
Abstract
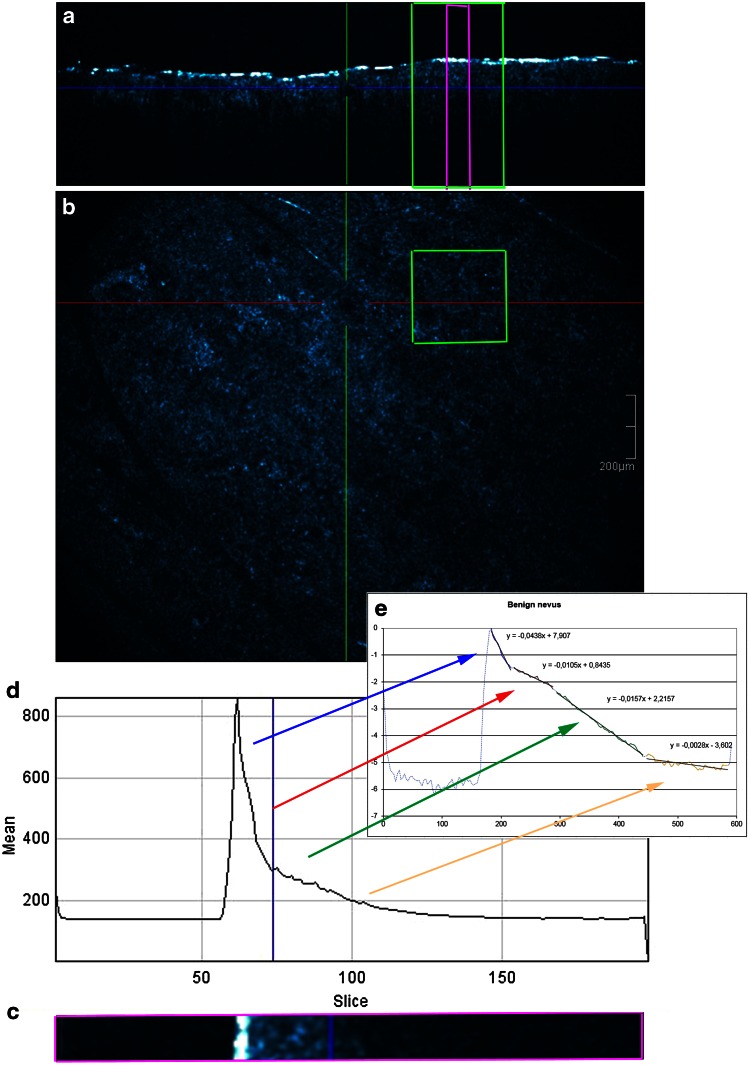
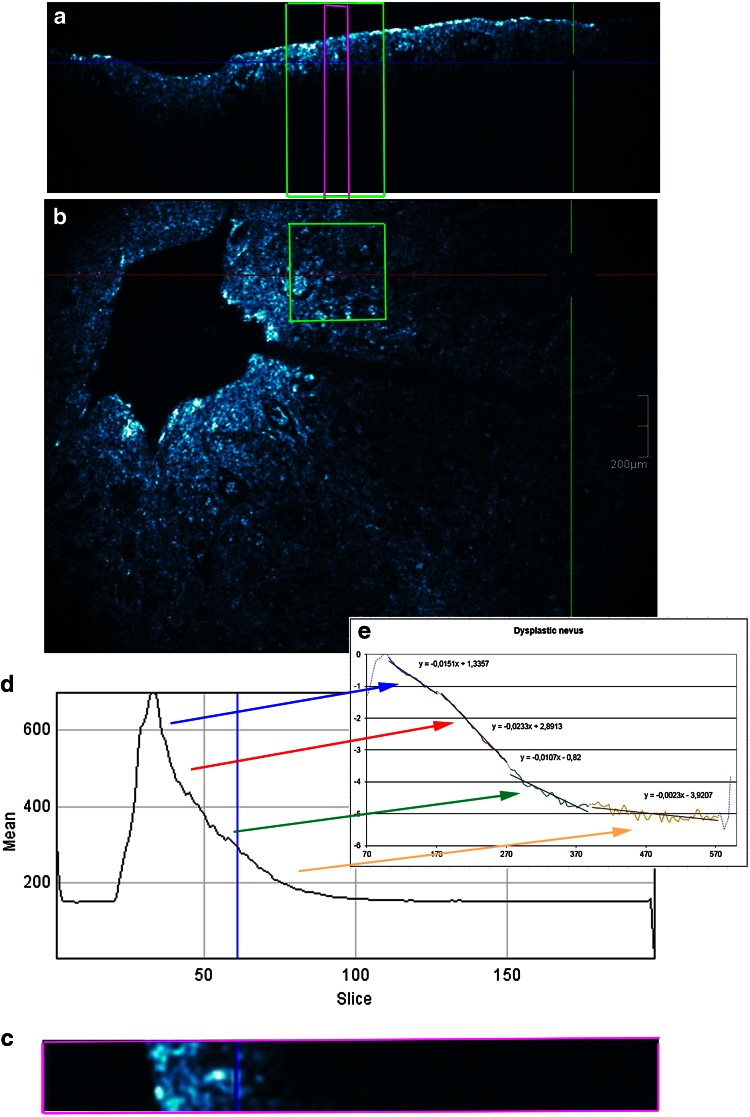
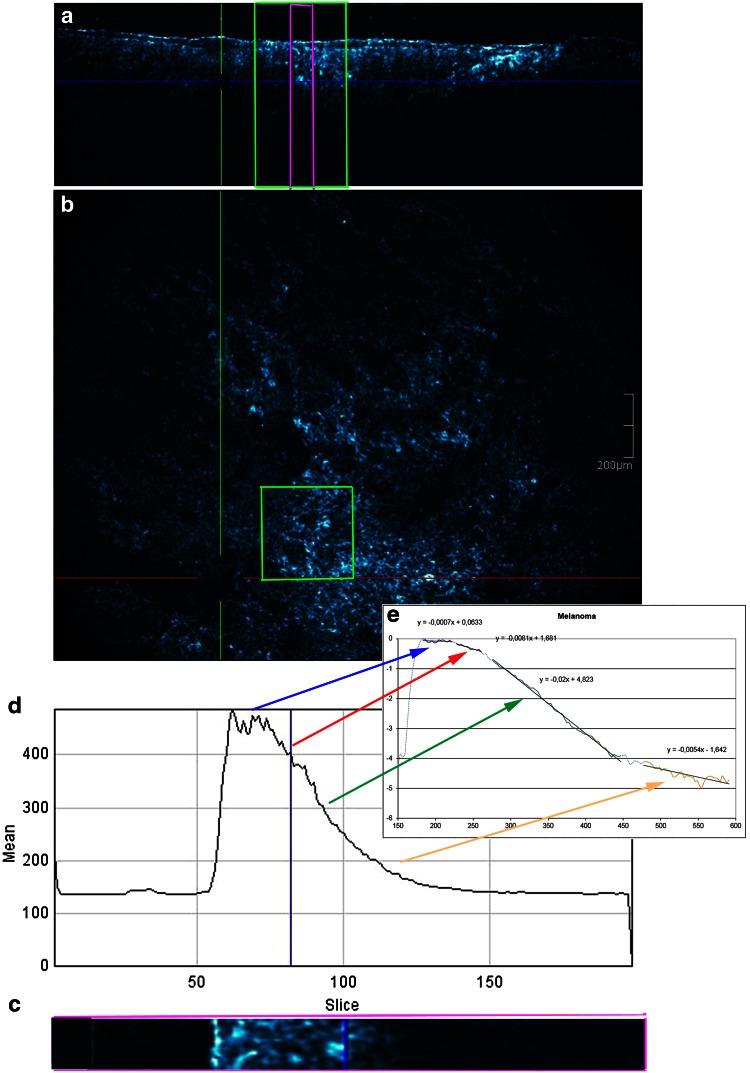
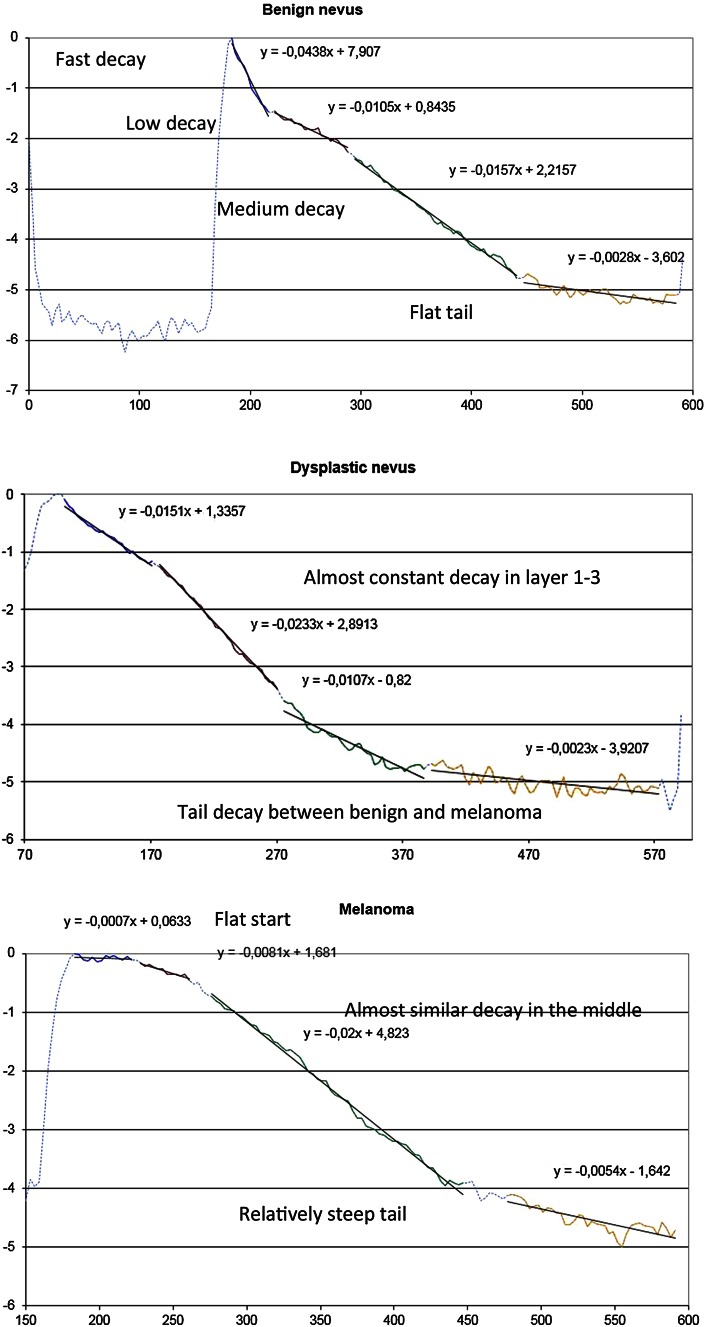
One of the most challenging problems in clinical dermatology is the early detection of melanoma. Reflectance confocal microscopy (RCM) is an added tool to dermoscopy improving considerably diagnostic accuracy. However, diagnosis strongly depends on the experience of physicians. High-definition optical coherence tomography (HD-OCT) appears to offer additional structural and cellular information on melanocytic lesions complementary to that of RCM. However, the diagnostic potential of HD-OCT seems to be not high enough for ruling out the diagnosis of melanoma if based on morphology analysis. The aim of this paper is first to quantify in vivo optical properties such as light attenuation in melanocytic lesions by HD-OCT. The second objective is to determine the best critical value of these optical properties for melanoma diagnosis. The technique of semi-log plot whereby an exponential function becomes a straight line has been implemented on HD-OCT signals coming from four successive skin layers (epidermis, upper papillary dermis, deeper papillary dermis and superficial reticular dermis). This permitted the HD-OCT in vivo measurement of skin entrance signal (SES), relative attenuation factor normalized for the skin entrance signal (µ raf1) and half value layer (z 1/2). The diagnostic accuracy of HD-OCT for melanoma detection based on the optical properties, µ raf1 , SES and z 1/2 was high (95.6, 82.2 and 88.9 %, respectively). High negative predictive values could be found for these optical properties (96.7, 89.3 and 96.3 %, respectively) compared to morphologic assessment alone (89.9 %), reducing the risk of mistreating a malignant lesion to a more acceptable level (3.3 % instead of 11.1 %). HD-OCT seems to enable the combination of in vivo morphological analysis of cellular and 3-D micro-architectural structures with in vivo analysis of optical properties of tissue scatterers in melanocytic lesions. In vivo HD-OCT analysis of optical properties permits melanoma diagnosis with higher accuracy than in vivo HD-OCT analysis of morphology alone.
Keywords: Absorption; Benign nevi; Dysplastic nevi; High-definition optical coherence tomography; In vivo optical properties; Light attenuation; Melanocytic lesions; Melanoma; Reflectance; Scattering.
Figures
References
-
- Balch CM, Gershenwald JE, Soong SJ, Thompson JF, Atkins MB, Byrd DR, Buzaid AC, Cochran AJ, Coit DG, Ding S, Eggermont AM, Flaherty KT, Gimotty PA, Kirkwood JM, McMasters KM, Mihm MC, Jr, Morton DL, Ross MI, Sober AJ, Sondak VK. Final version of 2009 AJCC melanoma staging and classification. J Clin Oncol. 2009;27:6199–6206. doi: 10.1200/JCO.2009.23.4799. - DOI - PMC - PubMed
-
- Boone M, Jemec GB, Del Marmol V. High-definition optical coherence tomography enables visualization of individual cells in healthy skin: comparison to reflectance confocal microscopy. Exp Dermatol. 2012;21:740–744. - PubMed
MeSH terms
LinkOut - more resources
Full Text Sources
Other Literature Sources
Medical
Research Materials
Miscellaneous
