. 2015 Nov 13:5:16595.
doi: 10.1038/srep16595.

Differentiation of human ESCs to retinal ganglion cells using a CRISPR engineered reporter cell line

Affiliations

Differentiation of human ESCs to retinal ganglion cells using a CRISPR engineered reporter cell line

Valentin M Sluch et al. Sci Rep. .

Abstract

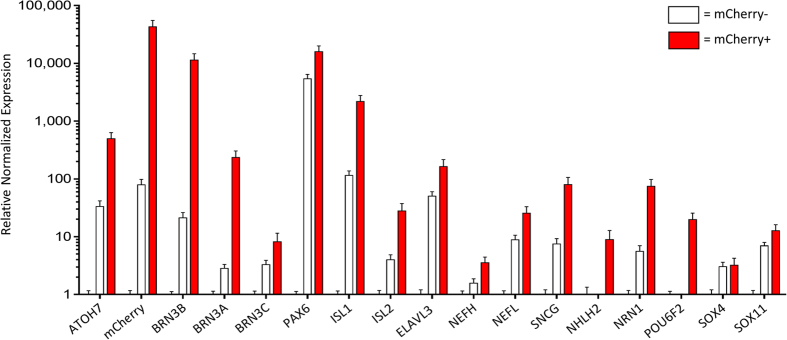
Retinal ganglion cell (RGC) injury and cell death from glaucoma and other forms of optic nerve disease is a major cause of irreversible vision loss and blindness. Human pluripotent stem cell (hPSC)-derived RGCs could provide a source of cells for the development of novel therapeutic molecules as well as for potential cell-based therapies. In addition, such cells could provide insights into human RGC development, gene regulation, and neuronal biology. Here, we report a simple, adherent cell culture protocol for differentiation of hPSCs to RGCs using a CRISPR-engineered RGC fluorescent reporter stem cell line. Fluorescence-activated cell sorting of the differentiated cultures yields a highly purified population of cells that express a range of RGC-enriched markers and exhibit morphological and physiological properties typical of RGCs. Additionally, we demonstrate that aligned nanofiber matrices can be used to guide the axonal outgrowth of hPSC-derived RGCs for in vitro optic nerve-like modeling. Lastly, using this protocol we identified forskolin as a potent promoter of RGC differentiation.


Figures

Figure 1
Figure 1. Generation and differentiation of an RGC reporter stem cell line.
(a) Schematic illustration depicting the reporter design. CRISPR-Cas9 was used to target the stop codon of BRN3B in H7 hESCs. A P2A linked membrane targeted mCherry was added to the BRN3B ORF by homologous recombination. Following translation, the BRN3B transcription factor protein is localized to the nucleus while mCherry is targeted to the cell membrane. (b) Schematic of RGC differentiation protocol. (c) Phase microscopy of differentiation over time. Cultures become confluent by day 10. (d) Phase and fluorescence comparison microscopy of differentiation. mCherry fluorescence becomes visible on day 25. More mCherry+ cells form over time and cell bodies become clearly visible. (c,d) Scale bars = 100 μm.
Figure 2
Figure 2. Retinal development is recapitulated in differentiating stem cells.
(a–c) Temporal qPCR analysis of differentiation. Gene expression was first normalized to GAPDH and CREBBP, and then normalized to the value of undifferentiated A81-H7 hESCs. Error bars represent SEM. (a) Expression of eye field transcription factors. (b) Expression of optic vesicle, neural retina markers, and neuronal markers. (c) Expression of RGC-associated markers. (d) qPCR profile for presence of retinal cell types on day 40 of differentiation. Expression was normalized to GAPDH and CREBBP, A81-H7 d0 cells (black) were compared to differentiated cultures (red). Error bars represent SEM. Cell type markers: neurons – VGLUT1, MAP2; Müller glia-GFAP, GS; RGCs - BRN3B; amacrine cells - GAD1, SLC6A9; bipolar cells - CABP5, PRKCA; horizontal cells - LHX1, PROX1; photoreceptors - CRX, RHO, RCVRN; RPE - MITF, RPE65. (e) Immunostaining of day 49 cultures shows remnants of retinal organization. CRX+ photoreceptor progenitors in green and mCherry+ RGCs in magenta. CRX+ cells – white arrows - appear to segregate from mCherry+ axons, suggesting division between the outer nuclear layer and the nerve fiber layer. Scale bar = 500 μm.
Figure 3
Figure 3. FACS purification of mCherry+ cells for culture and analysis.
(a) FACS setup. Differentiated non-reporter H7 hESCs were used to set a threshold for mCherry fluorescence from A81-H7 cells. Density plots and histograms are displayed, with the percent of mCherry fluorescent cells indicated below. (b) Microscopy images of mCherry+ sorted cells one-day post FACS. Phase and fluorescence images are shown. Scale bar = 100 μm. (c) Fluorescence microscopy images of mCherry+ and mCherry- sorted cells. Cells were fixed and stained for BRN3B one day after sorting. Scale bar = 100 μm.
Figure 4
Figure 4. qPCR analysis of sorted cells.
Day 40 sorted mCherry+/– cells were analyzed for RGC-associated genes. mCherry+ fraction shown by red bars, mCherry- fraction shown by clear bars. Expression was normalized to GAPDH and CREBBP, and then normalized to undifferentiated A81-H7 hESCs. Error bars represent SEM.
Figure 5
Figure 5. Sorted mCherry+ cells stain for RGC-enriched proteins.
Fluorescence microscopy images of mCherry+ sorted cells. Cells were fixed and stained for the indicated RGC-enriched proteins one day after sorting (a) or 6 days after sorting (b). mCherry+ cells stained positive for the mCherry protein, the general neuronal markers TUJ1, MAP2, and NEUN, and the more RGC-enriched markers BRN3B, BRN3A, NEFH, PAX6, THY1, RBPMS, ISL1, and SNCG. The cells also stained with the pan-BRN3 antibody that recognizes all three BRN3 members. Hoechst was used for DNA staining. Scale bars = 100 μm.
Figure 6
Figure 6. Sorted mCherry+ cells show ultrastructural and electrophysiological properties consistent with RGCs.
(a) TEM of mCherry+ RGCs one week post-sorting. A81-H7 RGCs feature a large euchromatic nucleus, prominent rough endoplasmic reticula (arrowheads, bolded inset is a magnification of the dashed box), and an axon hillock (arrow). (b) TEM of neuronal processes showed that processes ranged in caliber from 0.2 to 2 μm. This representative micrograph displays processes containing longitudinally arranged neurofilament, mitochondria, and smooth endoplasmic reticula. Scale bars are (a) 2 μm and (b) 500 nm. (c) Spontaneous action potentials recorded in a cultured RGC under whole-cell current clamp. Time scale applies to all panels. (d) Injection of depolarizing current (bottom) causes the cell to fire a train of action potentials throughout the current injection (top), same cell as in (c). (e) A second representative example cell showing 20, 40, 60, or 80 pA depolarizing current injections (bottom: left to right) and the corresponding increases in the number of action potentials generated (top). Vm is membrane voltage. (f) Responses to 50 ms local dendritic puff applications of 100 μM kainate in a cultured RGC under whole-cell voltage-clamp (Vm = −70 mV). Left: average of baseline responses. Center: average of responses after bath application of AMPA/KA receptor antagonist NBQX (20 mM). Right: average of responses after NBQX washout.
Figure 7
Figure 7. Differentiated cultures grow aligned axons on nanofiber scaffolds and addition of forskolin can improve stem cell differentiation to RGCs.
(a) Fluorescence microscopy image for mCherry. Differentiated retinal cultures were dissociated and re-plated in Matrigel droplets on an aligned nanofiber scaffold that guides emerging neurite outgrowth. Scale bar = 1 mm. (b,c) Differentiated day 49 cultures were dissociated and plated on nanofibers in Matrigel droplets for 18 days before fixation. (b) Immunostaining for TAU and mCherry proteins. Hoechst staining shows that while cells were largely restricted in their migration, the cultures sprouted long projections that stained positive for TAU, suggesting axonal identity, and mCherry, suggesting RGC origin. Scale bar = 500 μm. (c) Immunostaining for TAU and MAP2 suggests that the RGC emanating projections are largely axonal since MAP2 appears to be restricted to the soma containing area of the dish (indicated by white arrows). Scale bar = 500 μm. (d) Matrigel droplets were loaded into a limited diffusion chamber of a 5 mm length. With limited diffusion, signaling cues from neighboring clusters may accelerate neurite outgrowth. (e) Whole-well microscopy scans of day 40 differentiated cultures. Addition of 25 μM forskolin from day 1 of differentiation until day 30 increases the number of differentiating mCherry+ cells as compared to control. (f) Flow cytometry analysis for percent of mCherry+ cells. Day 40 differentiated cells were treated with forskolin or DMSO for different times. Addition of 25 μM forskolin from day 1 of differentiation to day 6, 10, 20, or 30 increased the percentage of mCherry+ cells to similar extents, suggesting that the critical period for its mechanism of action is in the first week. *p < 0.01, **p < 0.05. N = 3. P values were 0.0005, 0.0032, 0.049, and 0.005, respectively. Unpaired two-tailed t-test was used to compare forskolin treated samples with control. Error bars represent standard deviation.

References

    1. Kingman S. Glaucoma is second leading cause of blindness globally. Bulletin of the World Health Organization 82, 887–888, S0042-96862004001100019 (2004). - PMC - PubMed
    1. Sluch V. M. & Zack D. J. Stem cells, retinal ganglion cells and glaucoma. Developments in ophthalmology 53, 111–121, 10.1159/000358409 (2014). - DOI - PMC - PubMed
    1. Welsbie D. S. et al. Functional genomic screening identifies dual leucine zipper kinase as a key mediator of retinal ganglion cell death. Proceedings of the National Academy of Sciences of the United States of America 110, 4045–4050, 10.1073/pnas.1211284110 (2013). - DOI - PMC - PubMed
    1. Wahlin K. J., Maruotti J. & Zack D. J. Modeling retinal dystrophies using patient-derived induced pluripotent stem cells. Advances in experimental medicine and biology 801, 157–164, 10.1007/978-1-4614-3209-8_20 (2014). - DOI - PMC - PubMed
    1. Sowden J. C. ESC-Derived Retinal Pigmented Epithelial Cell Transplants in Patients: So Far, So Good. Cell stem cell 15, 537–538, 10.1016/j.stem.2014.10.008 (2014). - DOI - PubMed

Publication types

MeSH terms