. 2016 Jan 22;118(2):203-15.
doi: 10.1161/CIRCRESAHA.115.307399. Epub 2015 Nov 12.

Intact Heart Loose Patch Photolysis Reveals Ionic Current Kinetics During Ventricular Action Potentials

Affiliations

Intact Heart Loose Patch Photolysis Reveals Ionic Current Kinetics During Ventricular Action Potentials

Josefina Ramos-Franco et al. Circ Res. .

Abstract

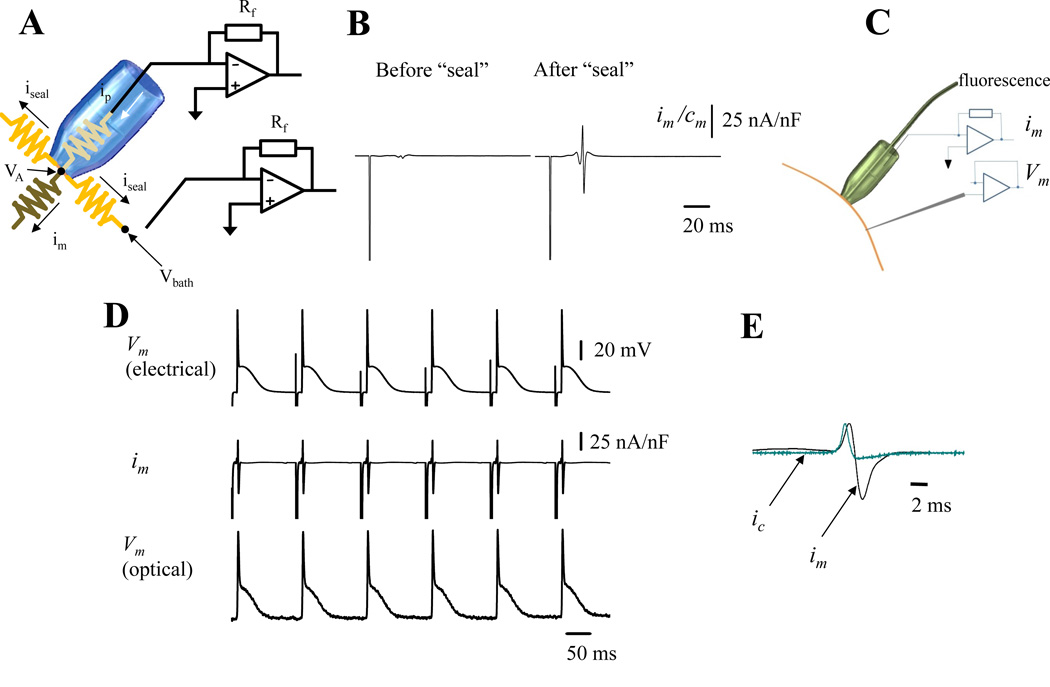
Rationale: Assessing the underlying ionic currents during a triggered action potential (AP) in intact perfused hearts offers the opportunity to link molecular mechanisms with pathophysiological problems in cardiovascular research. The developed loose patch photolysis technique can provide striking new insights into cardiac function at the whole heart level during health and disease.

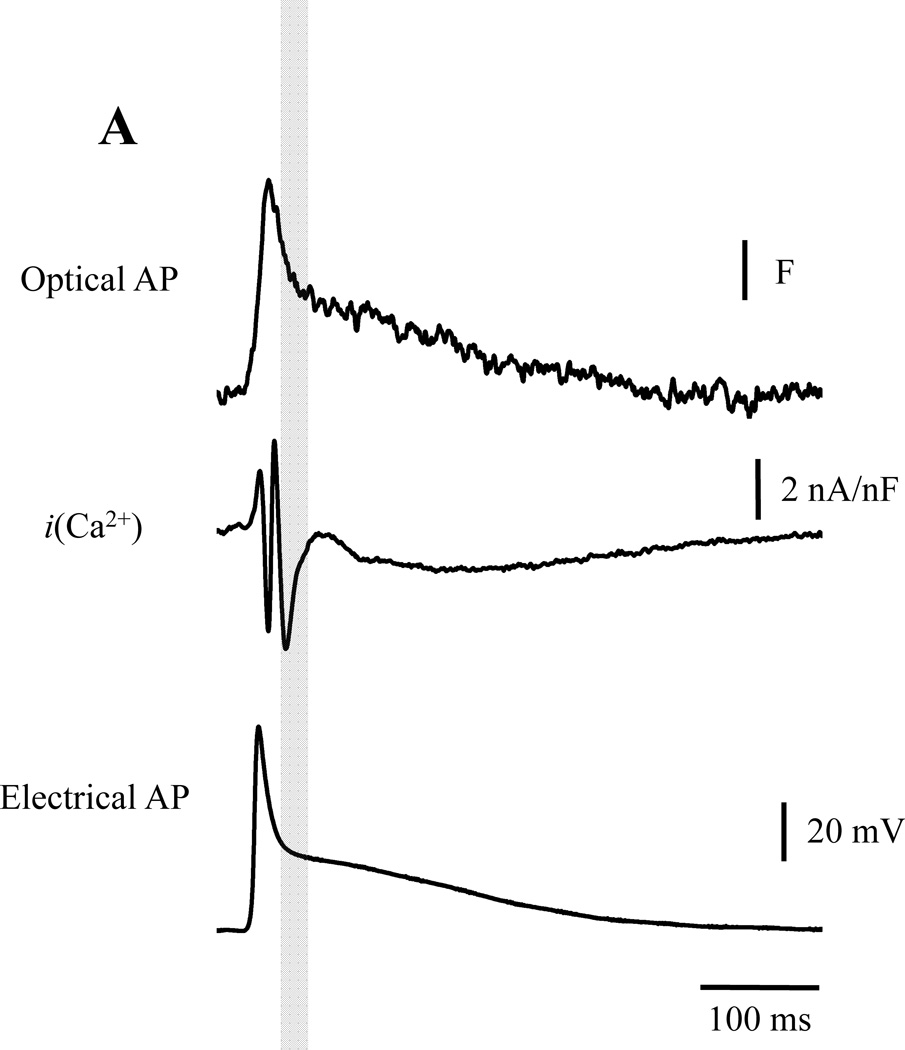
Objective: To measure transmembrane ionic currents during an AP to determine how and when surface Ca(2+) influx that triggers Ca(2+)-induced Ca(2+) release occurs and how Ca(2+)-activated conductances can contribute to the genesis of AP phase 2.

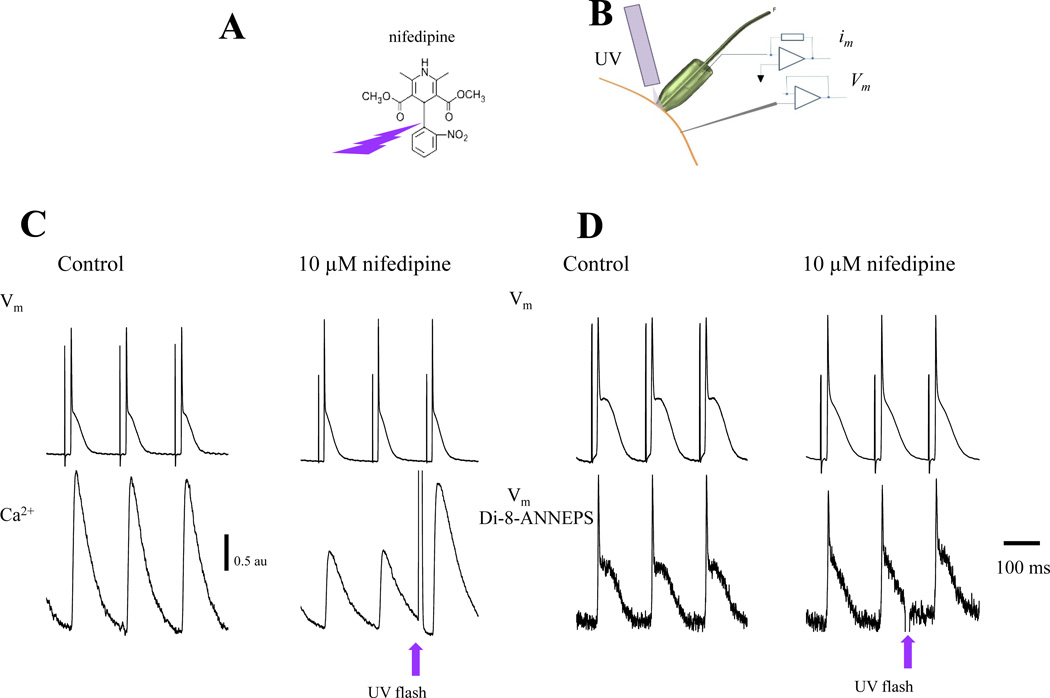
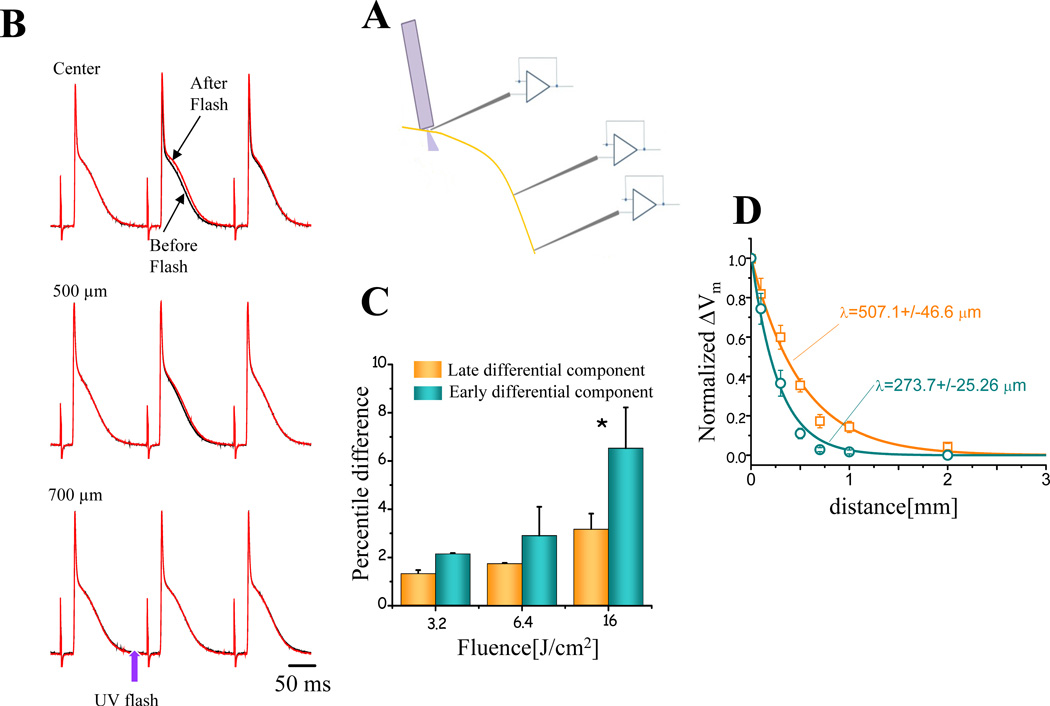
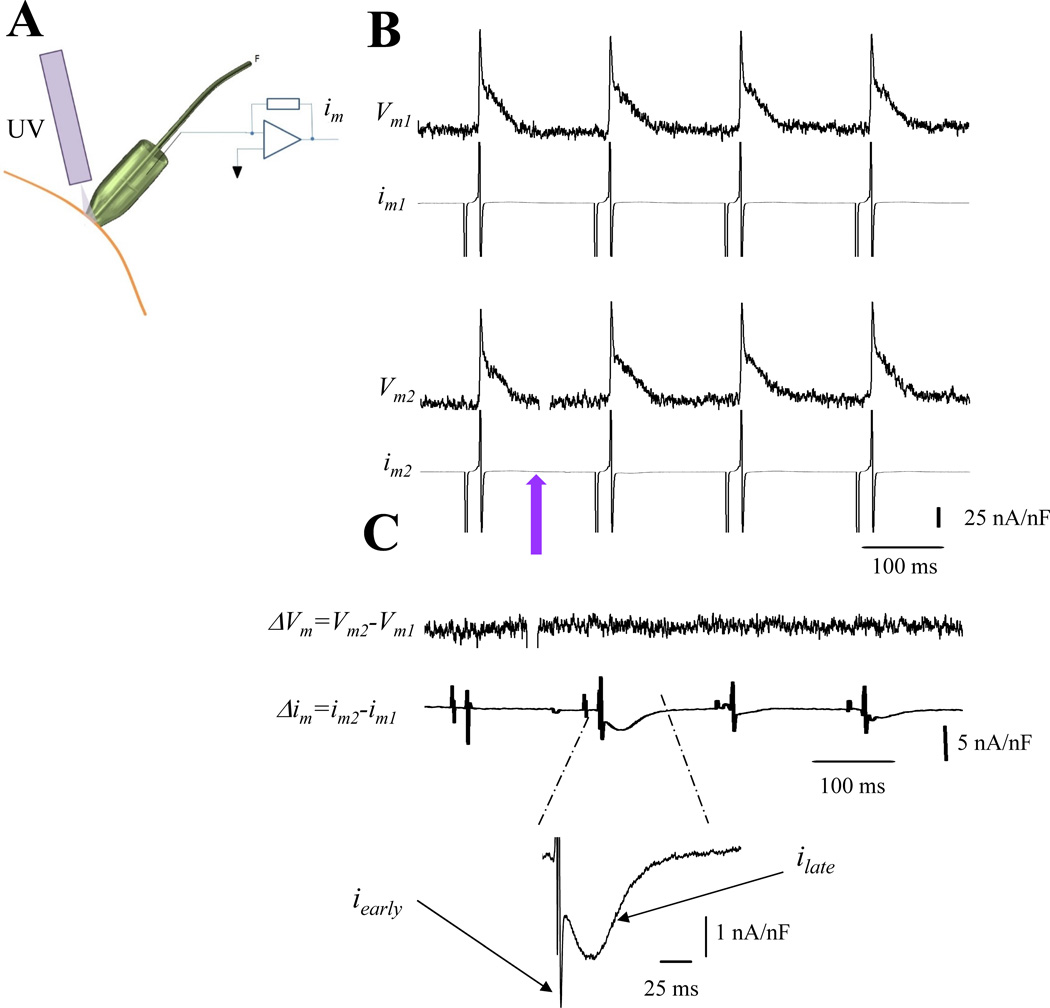
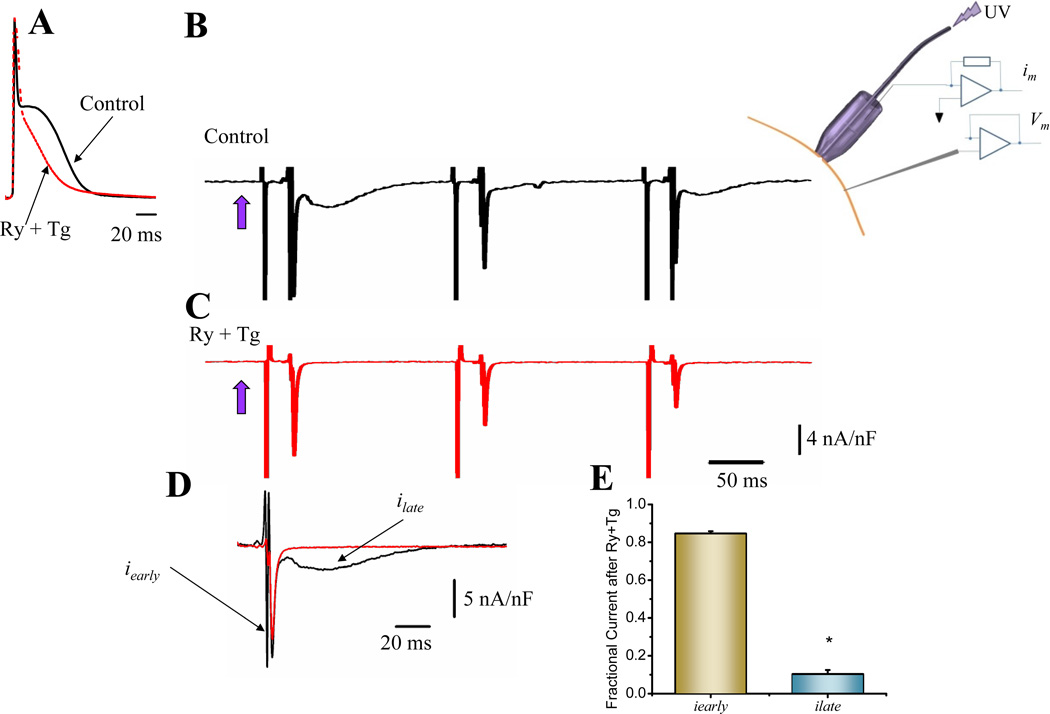
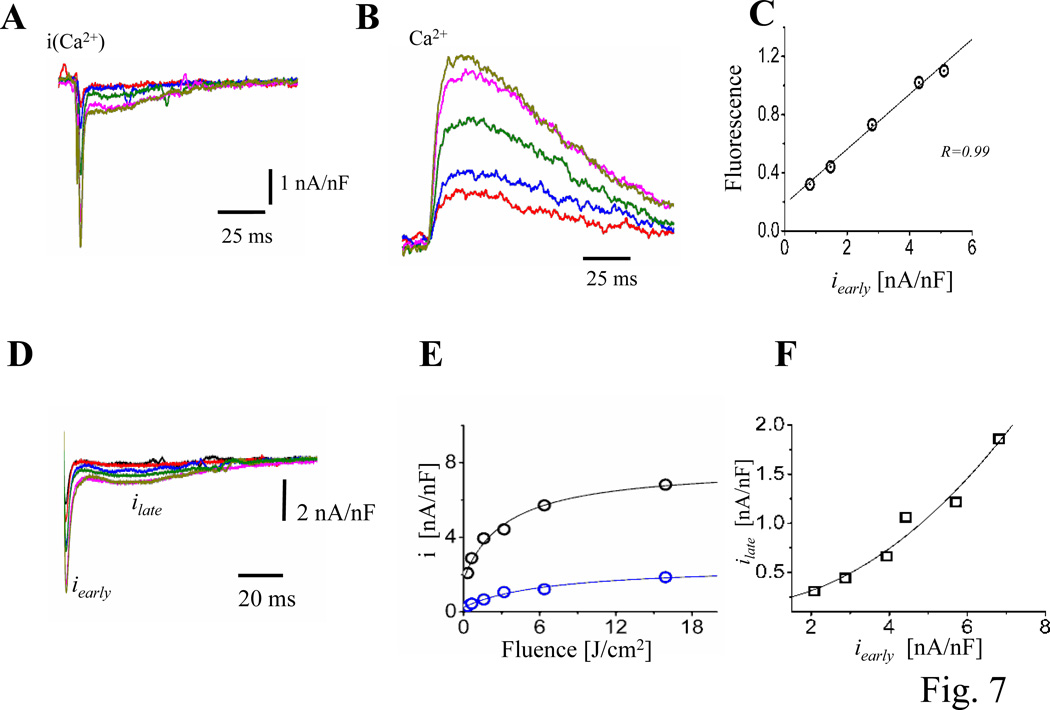
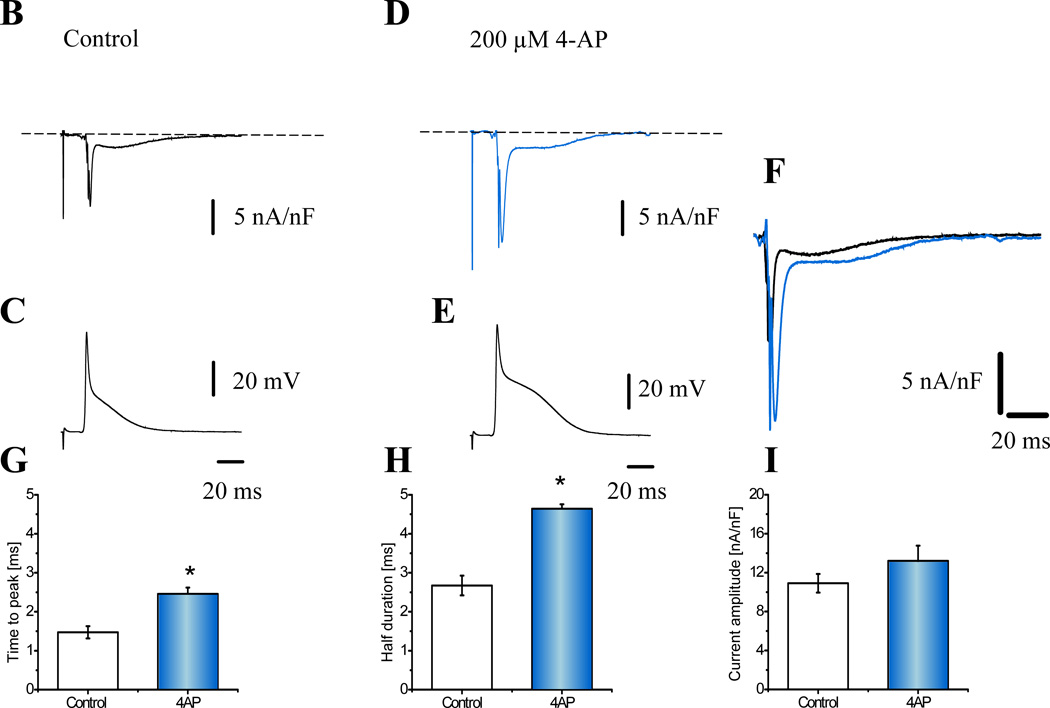
Methods and results: Loose patch photolysis allows the measurement of transmembrane ionic currents in intact hearts. During a triggered AP, a voltage-dependent Ca(2+) conductance was fractionally activated (dis-inhibited) by rapidly photo-degrading nifedipine, the Ca(2+) channel blocker. The ionic currents during a mouse ventricular AP showed a fast early component and a slower late component. Pharmacological studies established that the molecular basis underlying the early component was driven by an influx of Ca(2+) through the L-type channel, CaV 1.2. The late component was identified as an Na(+)-Ca(2+) exchanger current mediated by Ca(2+) released from the sarcoplasmic reticulum.

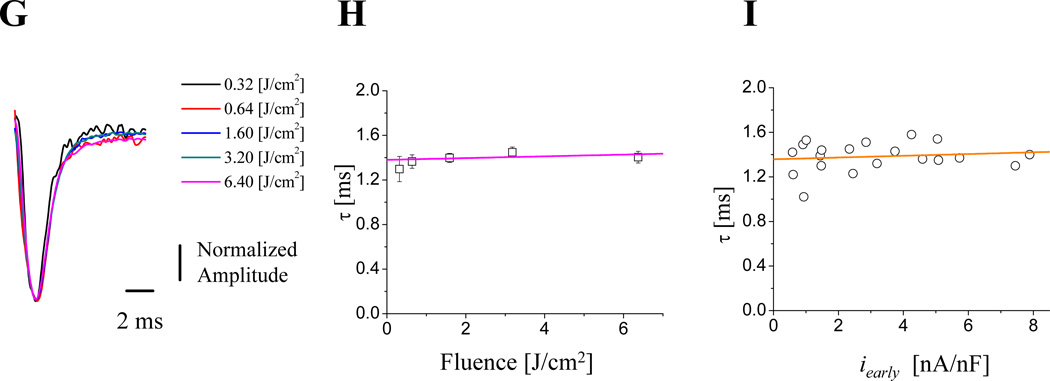
Conclusions: The novel loose patch photolysis technique allowed the dissection of transmembrane ionic currents in the intact heart. We were able to determine that during an AP, L-type Ca(2+) current contributes to phase 1, whereas Na(+)-Ca(2+) exchanger contributes to phase 2. In addition, loose patch photolysis revealed that the influx of Ca(2+) through L-type Ca(2+) channels terminates because of voltage-dependent deactivation and not by Ca(2+)-dependent inactivation, as commonly believed.

Keywords: action potentials; calcium signaling; excitation contraction coupling; ionic currents; nifedipine; sarcoplasmic reticulum.


Figures

Figure 1
Figure 1. Recording transmembrane currents on epicardium
A. An electrical scheme of the loose patch recording circuit. The bath and the interior of the pipette are clamped at the same potential. A second current to voltage converter sets the bath potential and acts as a guard to electrically increase the seal resistance. For more detailed information see Online Figure I B. Traces show the extracellularly recorded currents before and after the seal. Both recordings show a spike produced by the electrical stimulus applied at the apex of the heart to pace the organ. However, only the recordings obtained after the seal was applied show the membrane current during an AP. C. Scheme of the LPP arrangement showing a giant patch for measuring im, the intracellular microelectrode for electrically recording Vm and an PLFFM optical fiber positioned inside the giant pipette to optically record Vm optically. D. Electrical and optical recordings obtained from the epicardial layer of a mouse heart loaded with the potentiometric dye Di-8-ANNEPS and extracellularly paced at 6 Hz. E. Simultaneous recordings of the membrane current im (black) and the calculated capacitive current ic (teal). im is the summation of all the ionic currents plus the capacitive current under the patch. (n= 6 hearts).
Figure 2
Figure 2. Nifedipine blocking action removed by UV photolysis
A. Scheme of nifedipine photo-breakdown. Nifedipine, like some other dihydropyridines, contains an O-nitrobenzyl moiety that confers their photolability. The photolytic product no longer inhibits L-type Ca2+ current,. B. Experimental arrangement to measure Ca2+ or Vm using fluorescent dyes and electrical Vm by means of an intracellular microelectrode while applying UV pulses through an additional quartz multimode optical fiber. C. Simultaneous recordings of APs with an intracellular microelectrode and Ca2+ transients with Rhod-2 AM, before and after the perfusion of 10 µM nifedipine. Nifedipine reduced the amplitude of Ca2+ transients and the duration of AP. Upon illumination (UV flash), the breakdown of nifedipine occurs relieving the inhibition of L-type Ca2+ channels allowing an increase in the influx of Ca2+ that promotes a larger release from the SR as illustrated in the bottom panel. Similar results were obtained in 10 hearts. D. Concurrent electrical and optical recordings of AP in hearts loaded with Di-8-ANNEPS. Nifedipine induced a shortening of AP duration. However, nifedipine photolysis had no significant effect on the time course of APs (n=6 hearts).
Figure 3
Figure 3. Testing the electrotone imposed by the tissue neighboring the recording area
A. Scheme of the experiment. The microelectrode was positioned at different distances from the photolysis fiber. B. AP traces recorded at the indicated distances from the photolysis site, before (black traces) and after (red traces) the UV flash. The flash intensity (“fluence”) used for these records was 6.5 J/cm2. C. Effect of nifedipine photolysis effect on the AP repolarization. Two consecutive AP traces (before and after the flash at the photolysis site) were subtracted. The differential records obtained at increasing photolysis fluences (density of energy) display an early and a late differential component. The early and late components of this difference correspond to changes in AP phase 1 and 2, respectively. The percentile difference between the early and the late component (n=5 hearts) were calculated using the formula |Vmbefore flashVmafter flashVmbefore flash|×100. D. Spatial distribution of the photolysis induced changes in the early and late differential component of the membrane potential at different distances from the photolysis site. Teal corresponds to the early differential component, while the orange to the late differential component. The data were fitted with the spatial component of a cable equation: Vm(x)Vm(0)=exλ.
Figure 4
Figure 4. Dissecting ionic currents during triggered AP
A. Experimental arrangement to measure optically Vm and electrically im during photolysis. B. Traces of APs and im in the presence of 10 µM nifedipine. Upper and lower records (e.g., Vm1 and im1 and Vm2 and im2) were recorded under identical conditions in the same location. The violet arrow indicates the time when nifedipine was photolyzed (traces Vm2 and im2). C. Difference between Vm2Vm1Vm) and im2im1im). No changes were observed in the differential trace (ΔVm) after nifedipine photolysis. However, the subtraction im2− im1 revealed a nifedipine sensitive current that displays an early fast component and a slower late component (n= 6 hearts).
Figure 5
Figure 5. Ionic currents underlying action potential phase 2
A. Effect of Ry (10 µM) and Tg (2 µM) perfusion on epicardial APs. The treatment had a strong effect impairing the development of AP phase 2 (n=18 hearts). B. Differential ionic current after photolysis (violet arrow) of 10 µM nifedipine (control) (n=22 hearts). C. Differential ionic current in a heart perfused with Ry and Tg (n=9 hearts). D. Comparison of ionic current traces in absence and in presence of Ry and Tg. E. Histogram showing that the late component ilate is highly inhibited by Ry and Tg whereas the early iearly is mostly unaffected (n=5 p<0.02).
Figure 6
Figure 6. Probing the molecular nature of the differential ionic currents
A. 100 µM CdCl2 was able to block the fast component (iearly), in a reversible manner (n=3 hearts). B. Comparison of the amplitude and kinetics of iearly during CdCl2 treatment. C. Effect of 10 µM SEA0400 on epicardial APs. SEA0400 is a potent blocker of NCX and had a similar effect as Ry and Tg treatment on the AP repolarization (n=6 hearts). D. Effect of SEA0400 on the amplitude of epicardial Ca2+ transients. As expected, NCX’s block induced an increase in the Ca2+ transient amplitude (n=3 hearts). E. Effect of SEA0400 on the photolytically activated ionic currents (n=3 hearts). F. Histogram showing that SEA0400 had a selective effect on ilate indicating that in mouse epicardium, an NCX current activated by SR Ca2+ release is involved in the genesis of AP phase 2. * Populations means are significantly different at a level of 0.05 (ANOVA).
Figure 7
Figure 7. Testing the gain of CICR at the intact heart level
A. Ionic currents during triggered APs illustrating the effects of varying the fraction of nifedipine broken down by applying UV pulses of different energies. Similar results were obtained in 6 hearts. B. Ca2+ transients, measured with X-Rhod-5F AM, recorded simultaneously at the same location where the ionic currents (panel A) were obtained. The colors of the fluorescent traces correspond to the LPP currents. C. Relationship between Ca2+ transients amplitude and iearly. There is a direct relationship between intracellular Ca2+ and the Ca2+ influx (n=3 hearts). D. Ionic current traces obtained with different flash energies in hearts not perfused with exogenous Ca2+ indicators. E. Fluence dependency of ilate (blue) and iearly (black), both current components saturate for high fluences indicating that at these energies all nifedipine molecules were locally broken down. F. Nonlinear relationship between ilate and iearly (n=15 hearts). G. Time courses of normalized early currents recorded at diferent fluences. H. Relaxation time constants of the early currents as function of the photolysis fluence. I. Relaxation time constants of the early currents as function of the peak early current amplitude. (n= 4 hearts).
Figure 8
Figure 8. Defining the action potential phase of calcium entry into the cell
A. The maximum influx of Ca2+ occurs during phase-1 repolarization indicating that Ca2+ is entering the myocytes in a “tail current’ fashion (n=6 hearts) and that Ca2+ influx terminates because of a voltage dependent deactivation. B. Nifedipine sensitive currents during the corresponding AP (C.). D. and E. Illustrate the effect of 200 µM 4-AP. F. A comparison of the ionic currents before (black) and after 4-AP (blue). Panels G.–I. Histograms illustrating the effect of 4-AP on the ionic current kinetics and amplitude (n=4 Hearts). *Populations means are significantly different at a level of 0.05 (ANOVA).

Comment in

References

    1. Higuchi T, Nakaya Y. T wave polarity related to the repolarization process of epicardial and endocardial ventricular surfaces. Am Heart J. 1984;108:290–295. - PubMed
    1. Woodbury LA, Hecht HH, Christopherson AR. Membrane resting and action potentials of single cardiac muscle fibers of the frog ventricle. Am J Physiol. 1951;164:307–318. - PubMed
    1. Macfarlane WV. The plateau of the action potential of the frog ventricle. Circ Res. 1960;8:47–56. - PubMed
    1. Beeler GW, Reuter H. Membrane calcium current in ventricular myocardial fibres. J Physiol. 1970;207:191–209. - PMC - PubMed
    1. Beeler GW, Reuter H. The relation between membrane potential, membrane currents and activation of contraction in ventricular myocardial fibres. J Physiol. 1970;207:211–229. - PMC - PubMed

Publication types

MeSH terms