. 2015 Nov 3;13(5):884-7.
doi: 10.1016/j.celrep.2015.09.052. Epub 2015 Oct 22.

Defining Resistance and Tolerance to Cancer

Affiliations

Defining Resistance and Tolerance to Cancer

Adler R Dillman et al. Cell Rep. .

Abstract

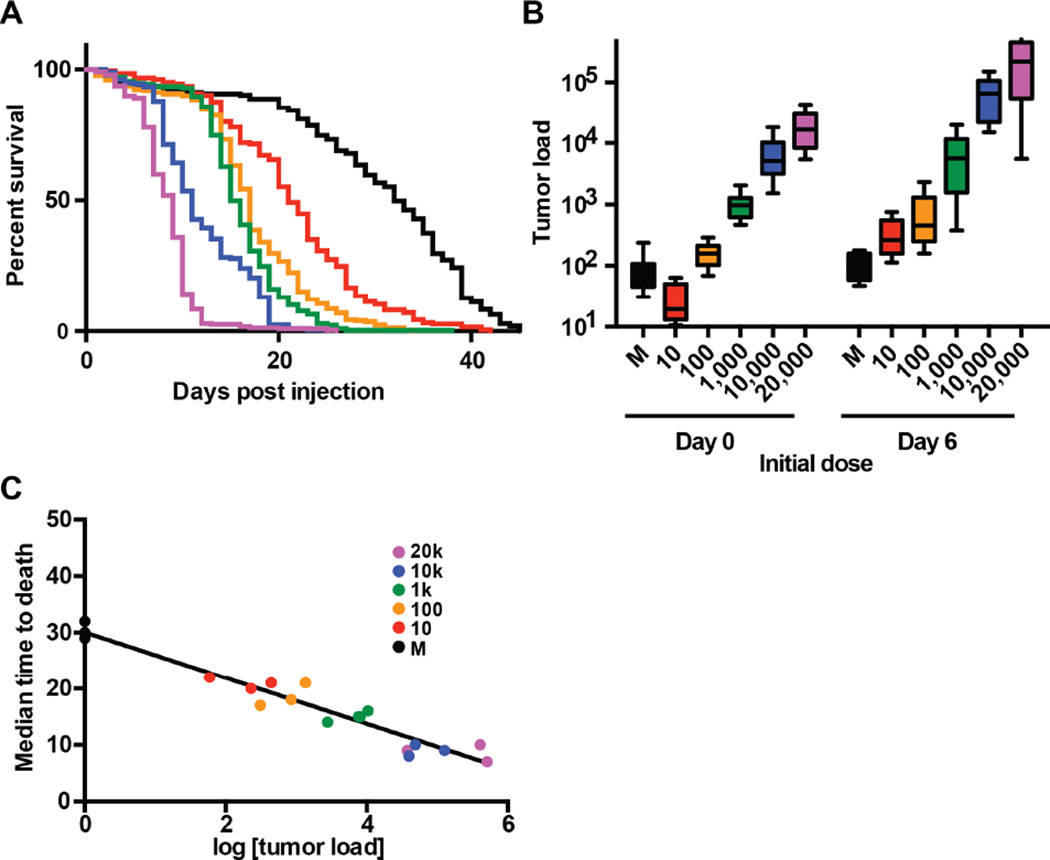
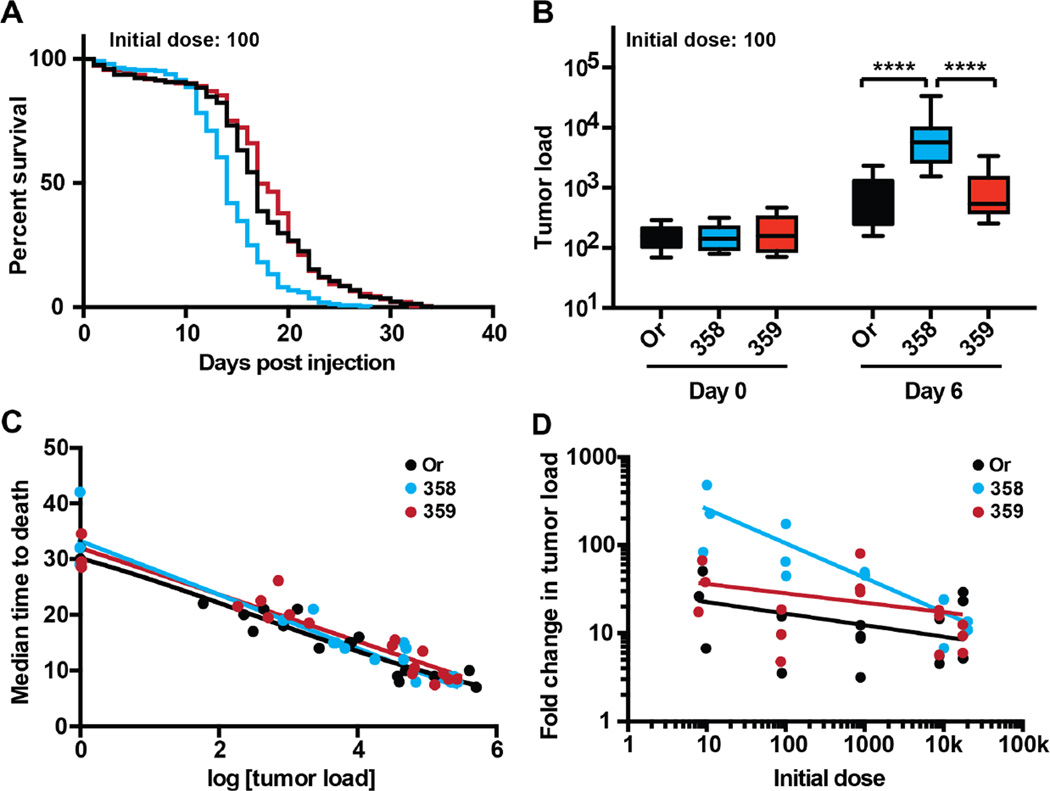
There are two ways to maintain fitness in the face of infection: resistance is a host's ability to reduce microbe load and disease tolerance is the ability of the host to endure the negative health effects of infection. Resistance and disease tolerance should be applicable to any insult to the host and have been explored in depth with regards to infection but have not been examined in the context of cancer. Here, we establish a framework for measuring and separating resistance and disease tolerance to cancer in Drosophila melanogaster. We plot a disease tolerance curve to cancer in wild-type flies and then compare this to natural variants, identifying a line with reduced cancer resistance. Quantitation of these two traits opens an additional dimension for analysis of cancer biology.


Figures

Figure 1
Figure 1. A cancer disease tolerance curve establishes a framework for separating resistance and disease tolerance to cancer
Wild-type (Oregon-R) adult male flies were injected with doses varying from 10–20,000 KRas hyperplastic cancer cells and were monitored for survival (disease progression) and cancer load (elicitor load). A. Survival curves were monitored for flies injected with 10–20,000 KRas hyperplastic cancer cells (n ≥ 180 flies per dose). The survival curves are significantly different (****, p<0.0001, Log-rank (Mantel-Cox) test). B. Rasv12-H7 fly cancer cells were injected to adult flies. The initial dose (day 0) and subsequent cancer growth (day 6) were quantitatively measured using a gfp marker present in the cancer cells but not the flies (n ≥ 150 flies per dose per day). C. A cancer disease tolerance curve was prepared by plotting pairs of cancer load and survival data for 18 cancer load/MTD pairs (n ≥ 110 flies per data point). This curve was fit with a linear regression model (r2>0.94) (Table S1).
Figure 2
Figure 2. Genetic variation alters resistance to cancer
Wild-type (Oregon-R) and natural variant adult male flies were injected with doses varying from 10–20,000 KRas hyperplastic cancer cells and were monitored for survival (disease progression) and cancer load (pathogen load). Wild-type (Oregon-R) is in black, RAL-358 is in blue, and RAL-359 is shown in red. A. A survival curve of adult flies injected with 100 cancer cells, comparing wild-type and natural variant flies. RAL-358 dies significantly faster than wild-type or RAL-359 (****, p<0.0001, Log-rank (Mantel-Cox) test) (n ≥ 180 flies per line). Whereas there is no significant difference between wild-type and RAL-359. B. A cancer growth plot showing the initial dose of 100 cells and the cancer burden of flies 6 days post injection. RAL-358 has a significantly higher cancer load than either wild-type or RAL-359 (****, p<0.0001, two-way ANOVA Tukey’s multiple comparisons test) (n ≥ 150 flies per dose per day). C. A cancer disease tolerance curve was prepared for each of the three fly lines (wild-type, RAL-358, and RAL-359) by plotting pairs of cancer load and survival data for 18 cancer load/MTD pairs for each line (n ≥ 110 flies per data point). These curves were each fit with a linear regression model (r2>0.94 for wild-type, r2>0.91 for RAL-358, and r2>0.91 for RAL-359). The slope of these lines is similar (−4.1 for wildtype, −4.8 for RAL-358, and −4.2 for RAL-359) and the 95% confidence intervals overlap. D. The ratio of cancer growth over six days PI. Wild-type is in black, RAL-358 is in blue, and RAL-359 is shown in red (n ≥ 150 flies per line per day in all of these experiments). The data for each of these lines were fit with a log-log non-linear regression, 0.12, 0.57, and 0.13 R2 for Or, RAL-358, and RAL-359 respectively. The slope of the log-log nonlinear regression is −0.13, −0.4, and −0.11 for Or, RAL-358, and RAL-359 respectively. The 95% confidence interval for the slope of RAL-358 remains negative while the 95% confidence interval for the slope of wild-type and RAL-359 ranges from negative to positive. In a non-linear log-log line regression F test, one curve does not fit all the data (p < 0.0001).

References

    1. Ayres JS, Freitag N, Schneider DS. Identification of Drosophila mutants altering defense of and endurance to Listeria monocytogenes infection. Genetics. 2008;178:1807–1815. - PMC - PubMed
    1. Ayres JS, Schneider DS. The role of anorexia in resistance and tolerance to infections in Drosophila. PLoS Biology. 2009;7:e1000150. - PMC - PubMed
    1. Caldwell RM, Schafer JF, Compton LE, Patterson FL. Tolerance to cereal leaf rusts. Science. 1958;128:714–715. - PubMed
    1. Heyneman LE, Herndon JE, Goodman PC, Patz EF., Jr Stage distribution in patients with a small (< or = 3 cm) primary nonsmall cell lung carcinoma. Implication for lung carcinoma screening. Cancer. 2001;92:3051–3055. - PubMed
    1. Howick VM, Lazzaro BP. Genotype and diet shape resistance and tolerance across distinct phases of bacterial infection. BMC Evolutionary Biology. 2014;14:56. - PMC - PubMed

Publication types