

A Metabolic Signature of Mitochondrial Dysfunction Revealed through a Monogenic Form of Leigh Syndrome
- PMID: 26565911
- PMCID: PMC4644511
- DOI: 10.1016/j.celrep.2015.09.054
A Metabolic Signature of Mitochondrial Dysfunction Revealed through a Monogenic Form of Leigh Syndrome
Abstract
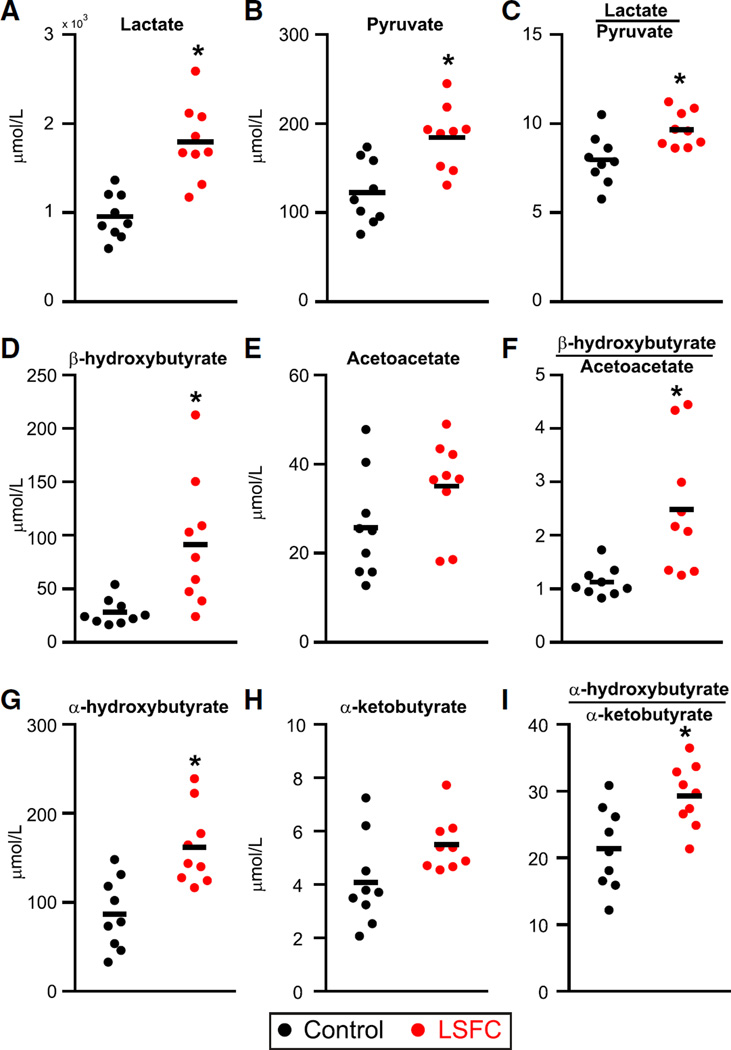
A decline in mitochondrial respiration represents the root cause of a large number of inborn errors of metabolism. It is also associated with common age-associated diseases and the aging process. To gain insight into the systemic, biochemical consequences of respiratory chain dysfunction, we performed a case-control, prospective metabolic profiling study in a genetically homogenous cohort of patients with Leigh syndrome French Canadian variant, a mitochondrial respiratory chain disease due to loss-of-function mutations in LRPPRC. We discovered 45 plasma and urinary analytes discriminating patients from controls, including classic markers of mitochondrial metabolic dysfunction (lactate and acylcarnitines), as well as unexpected markers of cardiometabolic risk (insulin and adiponectin), amino acid catabolism linked to NADH status (α-hydroxybutyrate), and NAD(+) biosynthesis (kynurenine and 3-hydroxyanthranilic acid). Our study identifies systemic, metabolic pathway derangements that can lie downstream of primary mitochondrial lesions, with implications for understanding how the organelle contributes to rare and common diseases.
Copyright © 2015 The Authors. Published by Elsevier Inc. All rights reserved.
Figures


References
-
- Adams SH, Hoppel CL, Lok KH, Zhao L, Wong SW, Minkler PE, Hwang DH, Newman JW, Garvey WT. Plasma acylcarnitine profiles suggest incomplete long-chain fatty acid beta-oxidation and altered tricarboxylic acid cycle activity in type 2 diabetic African-American women. J. Nutr. 2009;139:1073–1081. - PMC - PubMed
-
- Al-Dirbashi OY, Rashed MS, Al-Mokhadab MA, Al-Qahtani K, Al-Sayed MA, Kurdi W. Stable isotope dilution analysis of N-acetylaspartic acid in urine by liquid chromatography electrospray ionization tandem mass spectrometry. Biomed. Chromatogr. 2007;21:898–902. - PubMed
-
- Burelle Y, Bemeur C, Rivard ME, Thompson Legault J, Boucher G, Morin C, Coderre L, Des Rosiers C LSFC Consortium. Mitochondrial vulnerability and increased susceptibility to nutrient-induced cytotoxicity in fibroblasts from leigh syndrome French canadian patients. PLoS ONE. 2015;10:e0120767. - PMC - PubMed
Publication types
MeSH terms
Substances
Grants and funding
LinkOut - more resources
Full Text Sources
Other Literature Sources
