. 2015;11(12):2233-46.
doi: 10.1080/15548627.2015.1112483.

Autophagy contributes to regulation of the hypoxia response during submergence in Arabidopsis thaliana

Affiliations

Autophagy contributes to regulation of the hypoxia response during submergence in Arabidopsis thaliana

Liang Chen et al. Autophagy. 2015.

Abstract

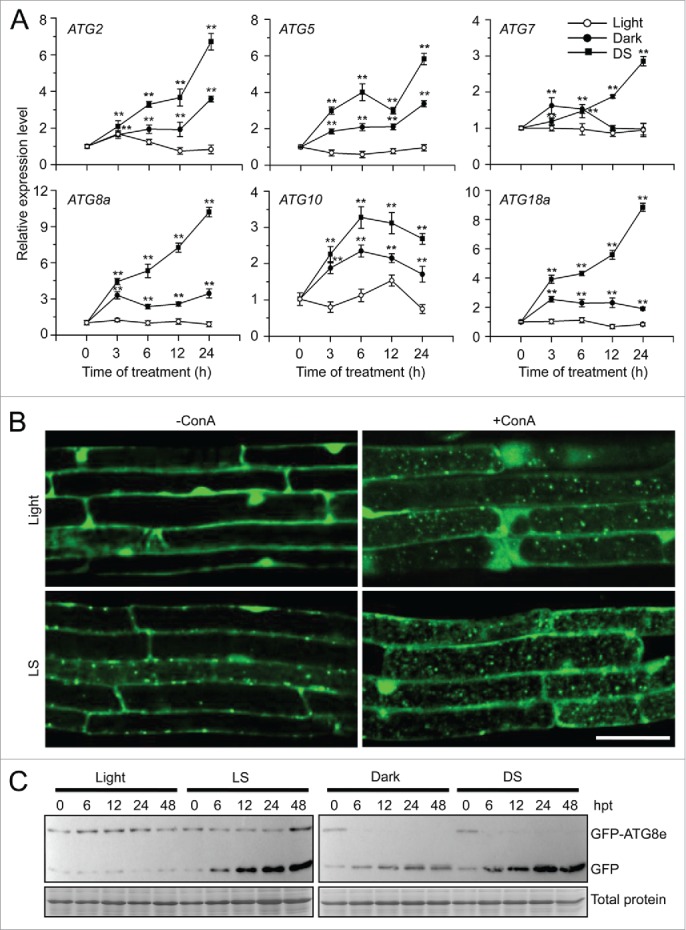
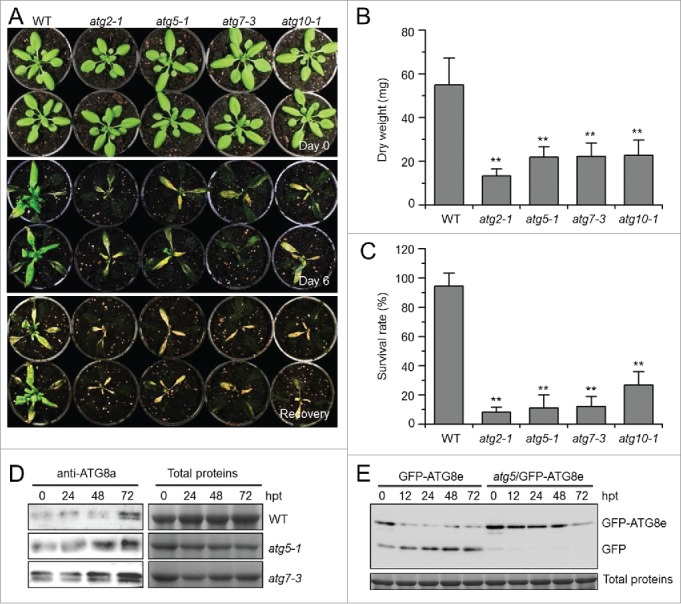
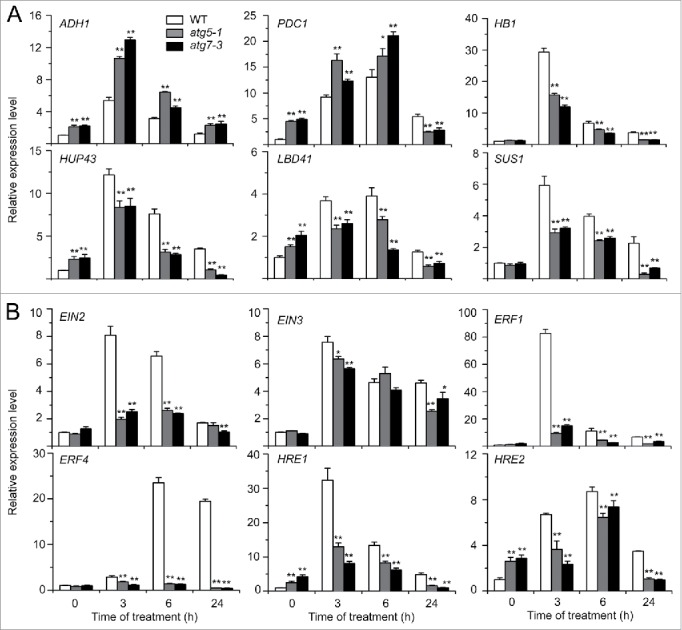
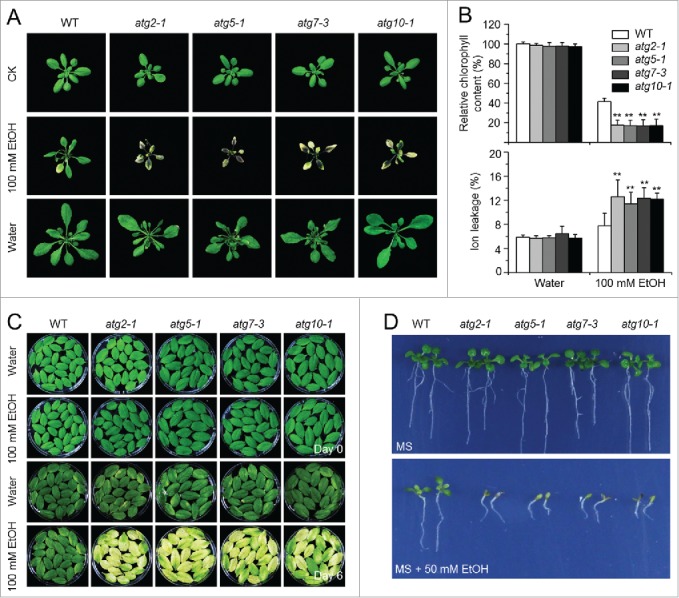
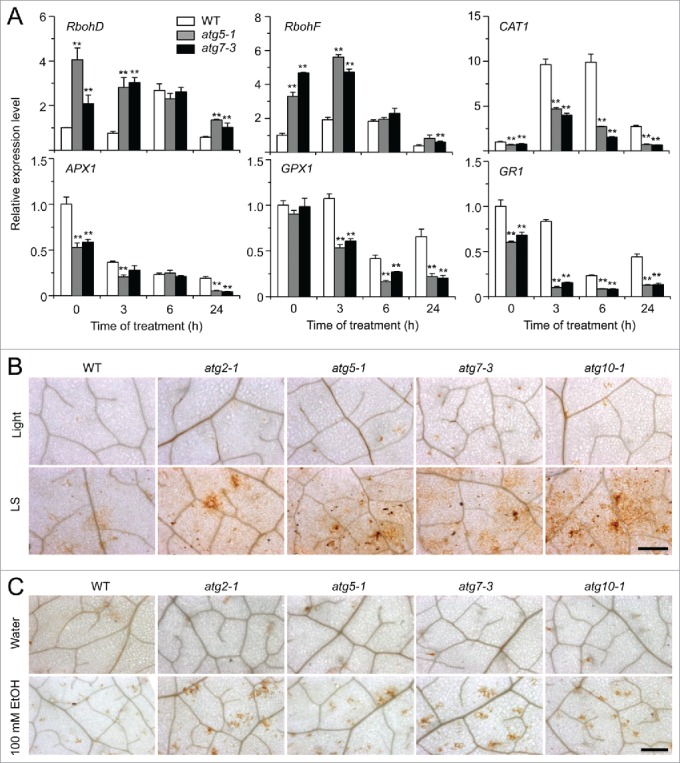
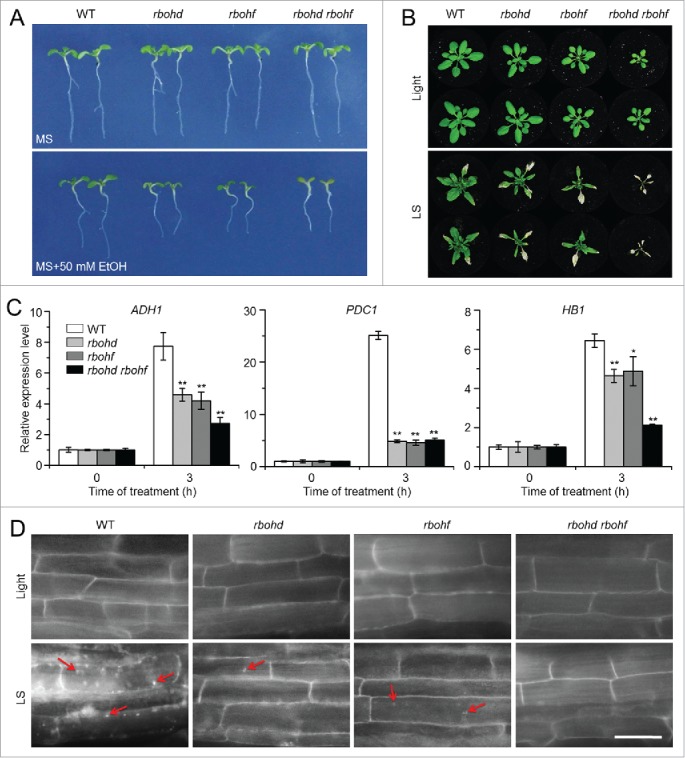
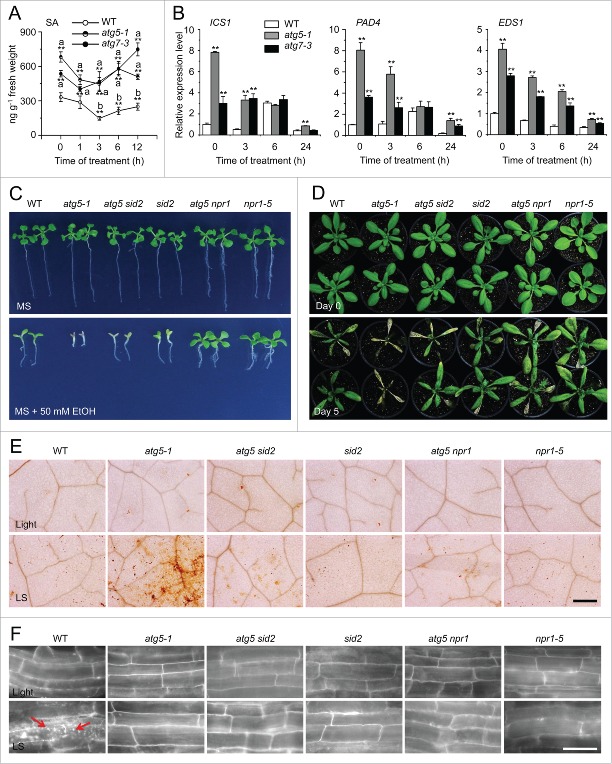
Autophagy involves massive degradation of intracellular components and functions as a conserved system that helps cells to adapt to adverse conditions. In mammals, hypoxia rapidly stimulates autophagy as a cell survival response. Here, we examine the function of autophagy in the regulation of the plant response to submergence, an abiotic stress that leads to hypoxia and anaerobic respiration in plant cells. In Arabidopsis thaliana, submergence induces the transcription of autophagy-related (ATG) genes and the formation of autophagosomes. Consistent with this, the autophagy-defective (atg) mutants are hypersensitive to submergence stress and treatment with ethanol, the end product of anaerobic respiration. Upon submergence, the atg mutants have increased levels of transcripts of anaerobic respiration genes (alcohol dehydrogenase 1, ADH1 and pyruvate decarboxylase 1, PDC1), but reduced levels of transcripts of other hypoxia- and ethylene-responsive genes. Both submergence and ethanol treatments induce the accumulation of reactive oxygen species (ROS) in the rosettes of atg mutants more than in the wild type. Moreover, the production of ROS by the nicotinamide adenine dinucleotide phosphate (NADPH) oxidases is necessary for plant tolerance to submergence and ethanol, submergence-induced expression of ADH1 and PDC1, and activation of autophagy. The submergence- and ethanol-sensitive phenotypes in the atg mutants depend on a complete salicylic acid (SA) signaling pathway. Together, our findings demonstrate that submergence-induced autophagy functions in the hypoxia response in Arabidopsis by modulating SA-mediated cellular homeostasis.

Keywords: autophagy; ethanol; hypoxia; reactive oxygen species; submergence.


Figures

Figure 1.
Figure 1.
Induction of autophagy by submergence. (A) qRT-PCR analyses showing the relative expression of autophagy-related genes (ATG2, ATG5, ATG7, ATG8a, ATG10, and ATG18a) upon submergence. Total RNA was isolated from rosettes of 4-wk-old soil-grown plants upon dark submergence (DS), and from control plants under constant darkness (Dark) and normal light/dark cycle (Light). The samples were harvested at 0, 3, 6, 12, and 24 h after treatment. Transcript levels relative to 0 h for each time point were normalized to the levels of ACT2 (Actin2). The experiments have been repeated 3 times (biological replicates) with similar results and the representative data from one replicate are shown. Data are average values ± SD (n = 3) of 3 technical replicates. Asterisks indicate significant differences from the untreated control (**, P < 0.01 by the Student t test). (B) GFP fluorescence in the root cells of GFP-ATG8e transformants under Light and light submergence (LS) conditions. One-wk-old Arabidopsis seedlings expressing GFP-ATG8e were not treated or LS-treated for 6 h with (+ConA) or without concanamycin A (−ConA) and visualized by confocal microscopy. Scale bar: 50 μm. (C) Immunoblot analysis showing the processing of GFP-ATG8e under Light, and upon LS, DS, and Dark treatments. Leaves from 4-wk-old plants were collected at 0, 6, 12, 24, and 48 h after treatment (hpt) and anti-GFP antibodies were used for immunoblotting. The GFP-ATG8e fusion and free GFP form are indicated on the right. Coomassie blue–stained total proteins are shown below the blots to indicate the amount of protein loaded per lane.
Figure 2.
Figure 2.
Autophagy-defective mutants show enhanced sensitivity to submergence. (A) Images of the wild type (WT) and atg mutants (atg2-1, atg5-1, atg7-3, and atg10-1) before treatment (Day 0) and at 6 d after light submergence (LS) treatment (Day 6), followed by a 6-d recovery (Recovery). (B) Dry weights and (C) survival rates of WT and atg mutants (atg2-1, atg5-1, atg7-3, and atg10-1) after 6-d LS treatment following recovery. Data of dry weights and survival rates are average values ± SD (n = 3) calculated from 3 independent experiments. For each experiment, 10 plants were used for each genotype. Asterisks indicate significant differences from WT (**, P < 0.01 by the Student t test). (D) Immunoblot analyses of ATG8 protein in WT and atg mutants (atg5-1 and atg7-3) upon LS treatment. Four-wk-old plants were not treated (0 h) and LS-treated for 24, 48, and 72 h, and leaves were collected. The anti-ATG8a antibodies were used for immunoblotting. (E) Detection of free GFP generated from transgenic lines expressing GFP-ATG8e in WT, atg5-1 backgrounds before and after LS treatment. Four-wk-old plant samples were collected at 0, 12, 24, and 48 h after treatment. The anti-GFP antibodies were used for protein blotting analysis. The GFP-ATG8e fusion and free GFP form were indicated on the right. Coomassie blue–stained total proteins are shown on the right (D) or below the blots (E) to indicate the amount of protein loaded per lane.
Figure 3.
Figure 3.
Relative transcript levels of hypoxia-responsive genes (A) and ethylene-responsive genes (B) in the wild type (WT) and atg mutants (atg5-1 and atg7-3) upon submergence. Total RNA was isolated from 4-wk-old WT and atg mutants at 0, 3, 6, and 24 h after light submergence treatment. Transcript levels relative to WT at 0 h were normalized to that of ACT2. The experiments have been repeated 3 times with biological replicates and similar results were obtained. Data are average values ± SD (n = 3) of 3 technical replicates. Asterisks indicate significant differences from WT (*, P < 0.05; **, P < 0.01 by the Student t test).
Figure 4.
Figure 4.
Deficiency of autophagy attenuates plant tolerance to ethanol stress. (A) Image of the wild-type (WT) and atg mutants (atg2-1, atg5-1, atg7-3, and atg10-1) before treatment (CK) and after 6-d treatment with ethanol (EtOH) or water as a control (Water). Four-wk-old WT and atg mutants were sprayed with 100 mM ethanol or water for 6 d and photographs were taken at the end of treatment. (B) Relative chlorophyll contents and electrolyte leakage of WT and atg mutants (atg2-1, atg5-1, atg7-3, and atg10-1) at 6 d after spraying with water or 100 mM ethanol. The chlorophyll contents of wild-type samples treated with water were set to 100%, and the relative chlorophyll contents in the other samples were calculated accordingly. The ionic leakages (percentages) were calculated by comparison of leaked ionic strength to the corresponding total ionic strength. Data are average values ± SD (n = 3) of 3 biological replicates. For each replicate, >10 leaves were used for each genotype. Asterisks indicate significant differences from WT (**, P < 0.01 by the Student t test). (C) Phenotype of detached leaves from 4-wk-old WT and atg mutants (atg2-1, atg5-1, atg7-3, and atg10-1) upon water or 100 mM ethanol immersion. Photos were taken at 0 and 6 d after detachment. (D) Images of WT and atg mutants (atg2-1, atg5-1, atg7-3, and atg10-1) germinated on MS medium containing without and with 50 mM ethanol for 2 wk.
Figure 5.
Figure 5.
Role of ROS in the autophagy-mediated plant response to submergence and ethanol stresses. (A) Relative expression levels of genes encoding enzymes involved in production or reduction of ROS after light submergence (LS) treatment. Four-wk-old wild type (WT) and atg mutants (atg5-1 and atg7-3) upon LS treatment at 0, 3, 6, and 24 h were collected for total RNA extraction. The relative mRNA abundance was normalized to that of ACT2. The experiments have been repeated 3 times (biological replicates) with similar results and the representative data from one replicate are shown. Data are average values ± SD (n = 3) of 3 technical replicates. Asterisks indicate significant differences from WT (*, P < 0.05; **, P < 0.01 by the Student t test). (B, C) DAB staining showing the accumulation of ROS in the leaves of 4-wk-old atg mutants (atg2-1, atg5-1, atg7-3, and atg10-1) under normal growth conditions (Light), 3-d treatment with LS (B) and 100 mM ethanol (C). In contrast to weak signals in the WT leaves, strong ROS accumulation was detected in the atg mutants after LS and ethanol treatments. Scale bar: 500 μm.
Figure 6.
Figure 6.
The rboh mutants show enhanced sensitivity to ethanol and submergence stresses. (A) Images of the wild type (WT) and rboh mutants (rbohd, rbohf, and rbohd rbohf) germinated on MS medium containing no ethanol or 50 mM ethanol, for 2 wk. (B) Images of WT and rboh mutants (rbohd, rbohf, and rbohd rbohf) before treatment (Light) and at 6 d after light submergence (LS) treatment followed by a 9-d recovery. (C) Relative expression levels of hypoxia-responsive marker genes in WT and rboh (rbohd, rbohf, and rbohd rbohf) mutants upon LS treatment. Four-wk-old plants were LS-treated for 0 and 3 h, and leaves were collected for RNA extraction. Transcript levels relative to WT at 0 h were normalized to that of ACT2. The experiments have been repeated 3 times, with biological replicates, and similar results were obtained. Data are average values ± SD (n = 3) of 3 technical replicates. Asterisks indicate significant differences from WT (*, P < 0.05; **, P < 0.01 by the Student t test). (D) MDC staining of root cells from WT, rbohd, rbohf, and rbohd rbohf seedlings. One-wk-old seedlings were untreated and LS-treated for 24 h followed by staining with MDC. The labeled autophagosomes (arrows) were visualized by epifluorescence microscopy. Scale bar: 50 μm.
Figure 7.
Figure 7.
The enhanced submergence and ethanol sensitivity in autophagy-defective mutants requires salicylic acid signaling. (A) Measurement of endogenous SA contents in the wild type (WT) and atg mutants (atg5-1 and atg7-3). WT, atg5-1, and atg7-3 mutants were treated with submergence (LS) and leaves were collected at 0, 1, 3, 6, and 12 h after treatment for SA extraction and then analyzed by LC/MS. D6-SA was added as an internal quantitative standard. The experiments were repeated (biological replicates) twice, with similar results, and the representative data from one replicate are shown. Data are means ± SD calculated from 8 technical replicates (200 mg leaves harvested from 3 independent plants were pooled for each technical replicate). Asterisks with “a” indicate significant differences from that of the wild type at each time point and with “b” indicate significant differences from untreated wild-type control (*, P < 0.05; **, P < 0.01 by the Student t test). (B) Relative expression levels of SA biosynthesis genes in WT and atg mutants (atg5–1 and atg7–3) upon LS treatment. Total RNA was isolated from 4-wk-old WT and atg mutants under LS treatment for 0, 3, 6, and 24 h. The relative transcript levels were normalized to that of ACT2. *, P < 0.05; **, P < 0.01 by Student t test. (C) Images of WT, atg5–1, atg5 sid2, sid2, atg5 npr1, and npr1-5 seeds germinated on MS medium containing no ethanol or 50 mM ethanol, for 2 wk. (D) Images of WT, atg5-1, atg5 sid2, sid2, atg5 npr1, and npr1-5 plants before treatment (Day 0) and after a 6-d recovery after a 5-d LS treatment (Day 5). (E) DAB staining showing ROS levels in the leaves of 4-wk-old WT, atg5-1, atg5 sid2, sid2, atg5 npr1, and npr1-5 mutants under normal growth conditions (Light) and after 3-d LS treatment. Scale bar: 500 μm. (F) MDC staining showing autophagosome formation in the root cells of WT, atg5-1, atg5 sid2, sid2, atg5 npr1, and npr1-5 seedlings under normal light/dark (Light) and LS conditions. One-wk-old seedlings were not treated or LS-treated for 24 h following by staining with MDC. The labeled autophagosomes (arrows) were visualized by epifluorescence microscopy. Scale bar: 50 μm.

References

    1. Bailey-Serres J, Fukao T, Gibbs DJ, Holdsworth MJ, Lee SC, Licausi F, Perata P, Voesenek LACJ, van Dongen JT. Making sense of low oxygen sensing. Trends Plant Sci 2012; 17:129-38; PMID:22280796; http://dx.doi.org/ 10.1016/j.tplants.2011.12.004 - DOI - PubMed
    1. Bailey-Serres J, Voesenek LACJ. Flooding stress: acclimations and genetic diversity. Annu Rev Plant Biol 2008; 59:313-39; PMID:18444902; http://dx.doi.org/ 10.1146/annurev.arplant.59.032607.092752 - DOI - PubMed
    1. Voesenek LACJ, Sasidharan R. Ethylene– and oxygen signaling– drive plant survival during flooding. Plant Biol 2013; 15:426-35; PMID:23574304; http://dx.doi.org/ 10.1111/plb.12014 - DOI - PubMed
    1. Geigenberger P. Response of plant metabolism to too little oxygen. Curr. Opin. Plant Biol 2003; 6:247-56; PMID:12753974; http://dx.doi.org/ 10.1016/S1369-5266(03)00038-4 - DOI - PubMed
    1. Perata P, Voesenek LACJ. Submergence tolerance in rice requires Sub1A, an ethylene-response-factor-like gene. Trends Plant Sci 2007; 12:43-6; PMID:17208508; http://dx.doi.org/ 10.1016/j.tplants.2006.12.005 - DOI - PubMed

Publication types

MeSH terms