

Evolution of Minimum Mortality Temperature in Stockholm, Sweden, 1901-2009
- PMID: 26566270
- PMCID: PMC4892916
- DOI: 10.1289/ehp.1509692
Evolution of Minimum Mortality Temperature in Stockholm, Sweden, 1901-2009
Abstract
Background: The mortality impacts of hot and cold temperatures have been thoroughly documented, with most locations reporting a U-shaped relationship with a minimum mortality temperature (MMT) at which mortality is lowest. How MMT may have evolved over previous decades as the global mean surface temperature has increased has not been thoroughly explored.
Objective: We used observations of daily mean temperatures to investigate whether MMT changed in Stockholm, Sweden, from the beginning of the 20th century until 2009.
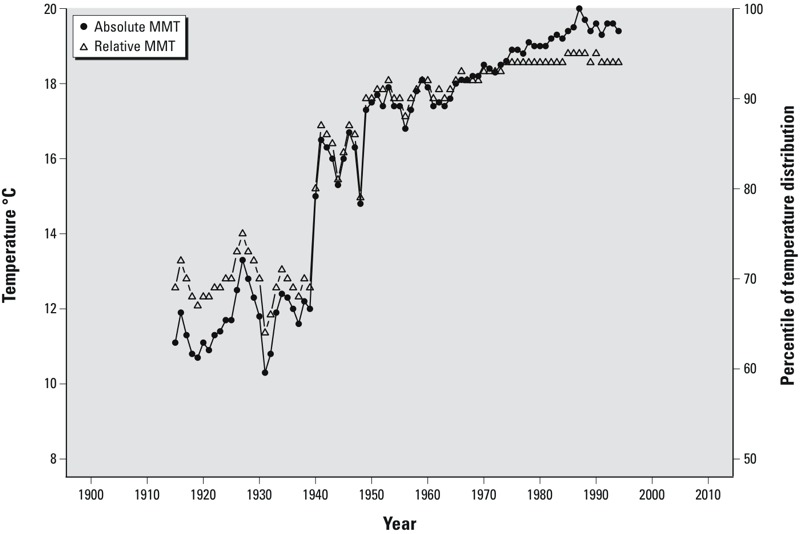
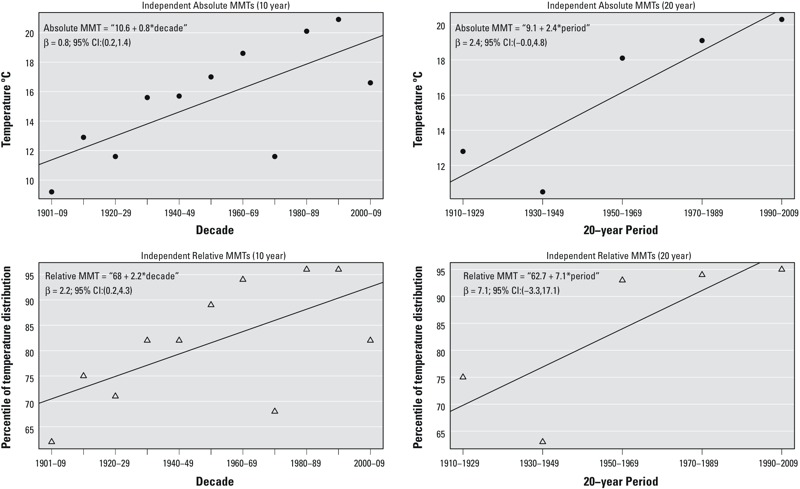
Methods: Daily mortality and temperature data for the period 1901-2009 in Stockholm, Sweden, were used to model the temperature-mortality relationship. We estimated MMT using distributed lag nonlinear Poisson regression models considering lags up to 21 days of daily mean temperature as the exposure variable. To avoid large influences on the MMT from intra- and interannual climatic variability, we estimated MMT based on 30-year periods. Furthermore, we investigated whether there were trends in the absolute value of the MMT and in the relative value of the MMT (the corresponding percentile of the same-day temperature distribution) over the study period.
Results: Our findings suggest that both the absolute MMT and the relative MMT increased in Stockholm, Sweden, over the course of the 20th century.
Conclusions: The increase in the MMT over the course of the 20th century suggests autonomous adaptation within the context of the large epidemiological, demographical, and societal changes that occurred. Whether the rate of increase will be sustained with climate change is an open question.
Citation: Oudin Åström D, Tornevi A, Ebi KL, Rocklöv J, Forsberg B. 2016. Evolution of minimum mortality temperature in Stockholm, Sweden, 1901-2009. Environ Health Perspect 124:740-744; http://dx.doi.org/10.1289/ehp.1509692.
Conflict of interest statement
The authors declare they have no actual or potential competing financial interests.
Figures
References
-
- Åström DO, Forsberg B, Edvinsson S, Rocklöv J. Acute fatal effects of short-lasting extreme temperatures in Stockholm, Sweden: evidence across a century of change. Epidemiology. 2013;24:820–829. - PubMed
-
- Baccini M, Biggeri A, Accetta G, Kosatsky T, Katsouyanni K, Analitis A, et al. Heat effects on mortality in 15 European cities. Epidemiology. 2008;19:711–719. - PubMed
MeSH terms
LinkOut - more resources
Full Text Sources
Other Literature Sources
Medical
