. 2015 Oct;30 Suppl 1(Suppl 1):S12-8.
doi: 10.3346/jkms.2015.30.S1.S12. Epub 2015 Oct 27.

Real-time Data Display System of the Korean Neonatal Network

Affiliations

Real-time Data Display System of the Korean Neonatal Network

Byong Sop Lee et al. J Korean Med Sci. 2015 Oct.

Abstract

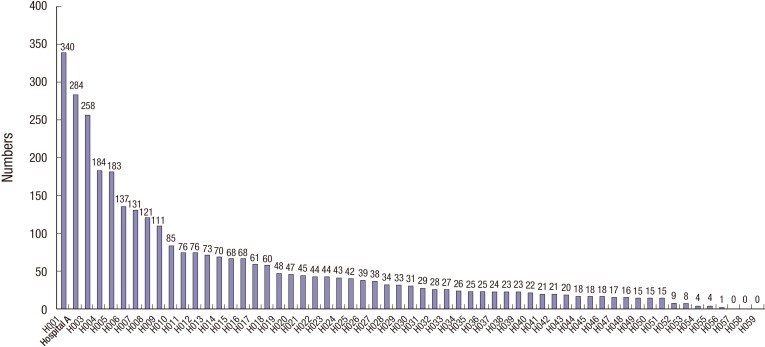
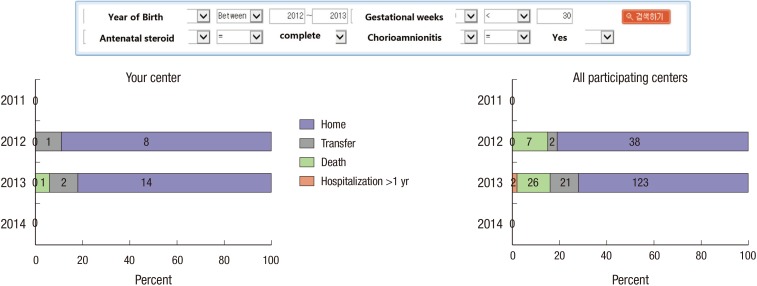
Real-time data reporting in clinical research networks can provide network members through interim analyses of the registered data, which can facilitate further studies and quality improvement activities. The aim of this report was to describe the building process of the data display system (DDS) of the Korean Neonatal Network (KNN) and its basic structure. After member verification at the KNN member's site, users can choose a variable of interest that is listed in the in-hospital data statistics (for 90 variables) or in the follow-up data statistics (for 54 variables). The statistical results of the outcome variables are displayed on the HyperText Markup Language 5-based chart graphs and tables. Participating hospitals can compare their performance to those of KNN as a whole and identify the trends over time. Ranking of each participating hospital is also displayed in terms of key outcome variables such as mortality and major neonatal morbidities with the names of other centers blinded. The most powerful function of the DDS is the ability to perform 'conditional filtering' which allows users to exclusively review the records of interest. Further collaboration is needed to upgrade the DDS to a more sophisticated analytical system and to provide a more user-friendly interface.

Keywords: Data Display System; Korean Neonatal Network; Quality Improvement.


Conflict of interest statement

DISCLOSURE: The authors have no conflicts of interest to disclose.

Figures

Fig. 1
Fig. 1. Data flow in the chart system of the Korean Neonatal Network. The database required for DDS are selectively extracted from the central KNN database by an automatic scheduler program and are separately stored. After member verification on the member's site, certified users can find a list of "report name" corresponding to the variables of interest in the web page of "Data Statistics". Once a variable is clicked (data field), a HTML5-based chart program in the remote server requests the data statistics of the variable that meet the specific conditions defined by users. K-NIH, Korean National Institute of Health; HTML, HyperText Markup Language; KNN, Korean Neonatal Network.
Fig. 2
Fig. 2. A representative chart showing the rankings of a fictitious center the hospitals in terms of number of annual admissions. Logged-in users from "hospital A" can see that their hospital is ranked second. The rankings of the other KNN hospitals are concealed and are displayed in descending order as H001, H002, etc.
Fig. 3
Fig. 3. Various types of charts that compare the data statistics of a fictitious hospital with those of entire centers in KNN. (A) Horizontal percentage stacked bar graphs that display the percentage of each category of respiratory support mode given at 28 days of life. (B) Vertical bar graphs that display the number of patients' registration who were born at a specific gestational week. (C) Horizontal number bar graphs that display the stacked number of annual hospitalizations of very-low-birth-weight infants. (D) Broken line plots that display the trend of mean base deficit in the blood gas analysis that is performed within the first hour of life.
Fig. 4
Fig. 4. Rearrangement of the plotted data by using the toggle function. (A) Five different categories of treatment policy for patent ductus arteriosus of a fictitious center are displayed as the horizontal percent bar chart with default setting. (B) Once the last two categories are inactivated by using the toggle function, a chart composed of the remaining three categories is newly displayed.
Fig. 5
Fig. 5. Data statistics defined by specified conditions. The horizontal percent bar charts shows the patients' status at the time of hospital discharges (survival and discharge to home, survival and transfer to other hospitals, death and hospitalization >1 yr) in a fictitious hospital. This is a newly generated cohort composed of the cases that meet the following four conditions: year of birth between 2012 and -2013, gestational weeks <30, complete course of antenatal steroid administration, and the presence of maternal histological chorioamnionitis.

References

    1. Hack M, Horbar JD, Malloy MH, Tyson JE, Wright E, Wright L. Very low birth weight outcomes of the National Institute of Child Health and Human Development Neonatal Network. Pediatrics. 1991;87:587–597. - PubMed
    1. Horbar JD. The Vermont-Oxford Neonatal Network: integrating research and clinical practice to improve the quality of medical care. Semin Perinatol. 1995;19:124–131. - PubMed
    1. Shah PS, Lee SK, Lui K, Sjörs G, Mori R, Reichman B, Håkansson S, Feliciano LS, Modi N, Adams M, et al. The International Network for Evaluating Outcomes of very low birth weight, very preterm neonates (iNeo): a protocol for collaborative comparisons of international health services for quality improvement in neonatal care. BMC Pediatr. 2014;14:110. - PMC - PubMed
    1. Thakkar M, O'Shea M. The role of neonatal networks. Semin Fetal Neonatal Med. 2006;11:105–110. - PubMed
    1. Horbar JD, Soll RF, Edwards WH. The Vermont Oxford Network: a community of practice. Clin Perinatol. 2010;37:29–47. - PubMed

Publication types