. 2016 Jan;26(1):12-23.
doi: 10.1101/gr.181008.114. Epub 2015 Nov 13.

RNA structure replaces the need for U2AF2 in splicing

Affiliations

RNA structure replaces the need for U2AF2 in splicing

Chien-Ling Lin et al. Genome Res. 2016 Jan.

Abstract

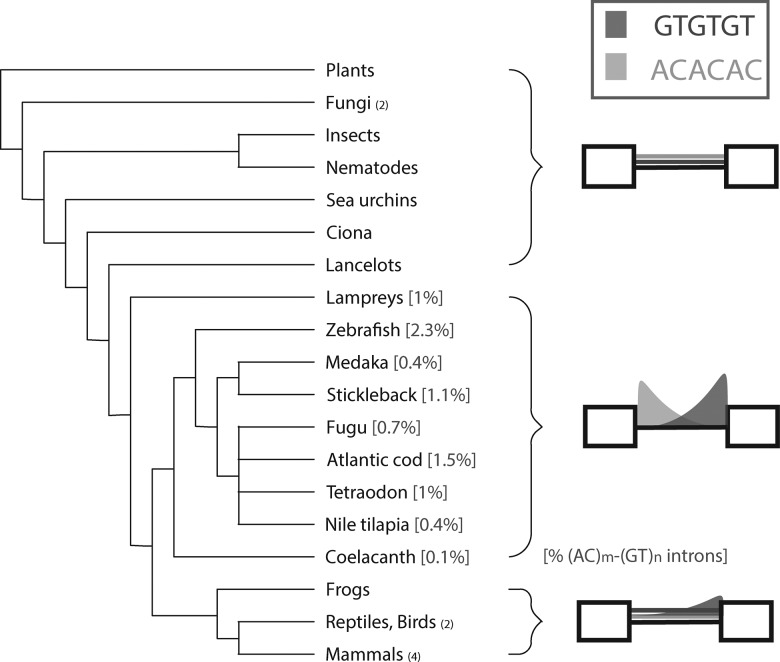
RNA secondary structure plays an integral role in catalytic, ribosomal, small nuclear, micro, and transfer RNAs. Discovering a prevalent role for secondary structure in pre-mRNAs has proven more elusive. By utilizing a variety of computational and biochemical approaches, we present evidence for a class of nuclear introns that relies upon secondary structure for correct splicing. These introns are defined by simple repeat expansions of complementary AC and GT dimers that co-occur at opposite boundaries of an intron to form a bridging structure that enforces correct splice site pairing. Remarkably, this class of introns does not require U2AF2, a core component of the spliceosome, for its processing. Phylogenetic analysis suggests that this mechanism was present in the ancestral vertebrate lineage prior to the divergence of tetrapods from teleosts. While largely lost from land dwelling vertebrates, this class of introns is found in 10% of all zebrafish genes.


Figures

Figure 1.
Figure 1.
The distribution of AC and GT repeats shows the most extreme divergence between human and zebrafish. (A) Plot of frequency (y-axis) of 5′ ss and BP around all 3′ and 5′ ss in human (blue line) and zebrafish (red). The position plotted is −200 to +100 relative to 3′ ss (−200 to “//” of x-axis) and −100 to +200 relative to 5′ ss (“//” to 200 of x-axis). (B) Plot of the frequency (y-axis) of AC and GT repeat hexamers around all 3′ and 5′ ss in human (blue line) and zebrafish (red). (C) Differences of motif positional distributions (L1 distance) of all 4096 hexamers in human-zebrafish comparison. The distance is the sum of the difference (e.g., area between two lines in A and B) of normalized frequencies relative to splice sites. Green arrows show AC repeat hexamers (i.e., ACACAC and CACACA). Blue arrow shows GT repeat hexamers. Yellow and red arrows indicate 5′ ss and BP, respectively.
Figure 2.
Figure 2.
AC and GT repeats co-occur across introns, not exons. Zebrafish introns containing AC repeats within 200 nt of the 5′ ss were examined for downstream intron GT repeats (left panel) or upstream intron repeats (right panel). Introns were binned according to the length of the GT repeats (# of repeats, x-axis) and AC repeats (# of repeats, y-axis). The observed frequency of introns with each combination of repeat length is shown on the graph. The heat map color of each bin indicates the fold difference of observed frequency over the co-occurrence frequency predicted by a model of independently distributed AC and GT repeats.
Figure 3.
Figure 3.
(AC)m-(GT)n introns represent a separate, structured class of introns in zebrafish. (A) Zebrafish introns are binned by length and folded by RNAfold. The average minimum free energy of folding for each bin is plotted for all introns and the subset of (AC)m-(GT)n introns defined by at least one occurrence of an AC and a GT repeat hexamer within 40 nt of the 5′ ss and 3′ ss, respectively. The 170-nt bin (circled) is expanded in B to show the distribution of the free energies of intron folding for the general population of introns (blue) and the (AC)m-(GT)n subclass (red). (C) The structure of an exemplar intron (intron 5 from cep97) was predicted and displayed by RNAfold. The 5′ ss, the 3′ ss, and the branchpoint site (determined experimentally by inverse PCR in vivo) are indicated with red arrows and text. (D) (AC)m-(GT)n repeat addition simulations in zebrafish introns demonstrating the effect of AC and GT repeats on intronic structure. (Left) Schematic for (AC)m-(GT)n repeat addition simulation. AC and GT dinucleotide repeats of varying length (0 ≤ m, n ≤ 20) were added 20 nt downstream from the 5′ ss and upstream of the 3′ ss. The repeats were determined to direct the overall structure if the upstream AC repeats base-paired to the downstream GT repeats forming a large hairpin. (Right) Simulation result. The percentage of introns in which the AC repeats base-paired to the GT repeats to form a hairpin structure was counted (y-axis) against the insertion of varying lengths of AC and GT repeats (x-axis). Resampling the data resulted in 95% confidence intervals of <1%.
Figure 4.
Figure 4.
The predicted hairpin in (AC)m-(GT)n introns is required for accurate splice site recognition. (A) The exemplar (AC)m-(GT)n intron from zebrafish cep97 intron 5 (blue) and a control from sacm1lb intron 16 (red) were recombined at their midpoints and cloned into splicing reporters to make chimeric intronic constructs. Construct nomenclature derives from suffix/prefix combinations listed on the left. Green color indicates regions of complementarity used to make compensatory mutations in CON-pair constructs. (B) RT-PCR from total RNA extracted from whole-body juvenile zebrafish. Primer amplicons span four exons centered on the AC-GT or CONTROL intron. RT-PCR from total RNA extracted from transiently transfected tissue culture cells and quantified (histogram). The predicted sizes of the constitutively spliced products are illustrated with arrows marked by lane numbers. (C) RNase mapping of AC-GT, CON-GT, and CON-pair introns. Structured regions inferred from protection from single-strand nucleases (see RNases T1 and A). (D) Intron substrates used in mapping were tested in a single intron splicing reporter construct, transfected into cells, and assayed and quantified as described above. Asterisk indicates statistical significance by paired t-test (P = 9 × 10⁻⁴) of three biological replicates.
Figure 5.
Figure 5.
The splicing of (AC)m-(GT)n introns requires components of U2 snRNP but not U2AF2. In vitro splicing substrates were prepared from the constructs used in Figure 4 and the model in vitro splicing construct Ad81. The in vitro–transcribed RNA was incubated in HeLa nuclear extract for the splicing assay. (A) The splicing of the Ad81 control was compared to the (AC)m-(GT)n intron with pre-incubation with either: no antibody, a control antibody, or increasing amounts of anti-U2AF2 antibody. The input pre-mRNA and the splicing products, including the lariat intermediate and free first exon from the first step of splicing, the free lariat, and ligated exon from the second step of splicing, were resolved on an 8M urea gel and visualized by autoradiography with a phosphoimager. (B) The comparison described above was repeated with antibody targeting SF3B1, a component of the U2 snRNP. (C) u2af2 knockdown (KD) in zebrafish embryos. The KD embryos developed without gross phenotypic defect by 48 h but with lower hatch rate. (D) Western blotting of U2af2 24 or 48 h after injection. Beta actin served as a loading control. (E) RT-PCR of single intron transcripts containing (AC)m-(GT)n repeats (left) or without the repeats (right). Pre-mRNA and/or spliced mRNA is depicted on the right of the gel images. A bracket indicates the smear of the PCR product, possibly due to the loss of splicing accuracy.
Figure 6.
Figure 6.
(AC)m-(GT)n introns predate the divergence of tetrapods from teleosts. The measurement of frequency distribution of AC and GT repeat hexamers around 5′ ss and 3′ ss was expanded to 24 genomes (listed in dendrogram). The degree and shape of AC and GT enrichment is illustrated in the cartoon. The percentage of (AC)m-(GT)n intron in the genome is indicated in brackets, and the number of genomes analyzed in the category is in parentheses.
Figure 7.
Figure 7.
Model for secondary structure-dependent splicing. (Left) Zebrafish (AC)m-(GT)n introns: 5′ ss and 3′ ss are brought closer by base-pairing of AC and GT repeats. This intronic bridging can override the requirement of U2AF2 for 3′ ss recognition. (Right) Human (GGG)m-(CCC)n introns: 16% of human introns contain multiple copies of complementary G and C triplets near 5′ ss and 3′ ss, respectively, that stabilize the intronic structure. They may bridge the splice sites and facilitate splicing as the zebrafish (AC)m-(GT)n introns.

References

    1. Auweter SD, Oberstrass FC, Allain FH. 2006. Sequence-specific binding of single-stranded RNA: Is there a code for recognition? Nucleic Acids Res 34: 4943–4959. - PMC - PubMed
    1. Bellamy-Royds AB, Turcotte M. 2007. Can Clustal-style progressive pairwise alignment of multiple sequences be used in RNA secondary structure prediction? BMC Bioinformatics 8: 190. - PMC - PubMed
    1. Bennett M, Michaud S, Kingston J, Reed R. 1992. Protein components specifically associated with prespliceosome and spliceosome complexes. Genes Dev 6: 1986–2000. - PubMed
    1. Bernstein FC, Koetzle TF, Williams GJ, Meyer EF Jr, Brice MD, Rodgers JR, Kennard O, Shimanouchi T, Tasumi M. 1977. The Protein Data Bank: a computer-based archival file for macromolecular structures. J Mol Biol 112: 535–542. - PubMed
    1. Bhardwaj A, Myers MP, Buratti E, Baralle FE. 2013. Characterizing TDP-43 interaction with its RNA targets. Nucleic Acids Res 41: 5062–5074. - PMC - PubMed

Publication types

LinkOut - more resources