. 2016 Jan 1;25(1):130-45.
doi: 10.1093/hmg/ddv460. Epub 2015 Nov 12.

Effect of genetic background on the dystrophic phenotype in mdx mice

Affiliations

Effect of genetic background on the dystrophic phenotype in mdx mice

William D Coley et al. Hum Mol Genet. .

Abstract

Genetic background significantly affects phenotype in multiple mouse models of human diseases, including muscular dystrophy. This phenotypic variability is partly attributed to genetic modifiers that regulate the disease process. Studies have demonstrated that introduction of the γ-sarcoglycan-null allele onto the DBA/2J background confers a more severe muscular dystrophy phenotype than the original strain, demonstrating the presence of genetic modifier loci in the DBA/2J background. To characterize the phenotype of dystrophin deficiency on the DBA/2J background, we created and phenotyped DBA/2J-congenic Dmdmdx mice (D2-mdx) and compared them with the original, C57BL/10ScSn-Dmdmdx (B10-mdx) model. These strains were compared with their respective control strains at multiple time points between 6 and 52 weeks of age. Skeletal and cardiac muscle function, inflammation, regeneration, histology and biochemistry were characterized. We found that D2-mdx mice showed significantly reduced skeletal muscle function as early as 7 weeks and reduced cardiac function by 28 weeks, suggesting that the disease phenotype is more severe than in B10-mdx mice. In addition, D2-mdx mice showed fewer central myonuclei and increased calcifications in the skeletal muscle, heart and diaphragm at 7 weeks, suggesting that their pathology is different from the B10-mdx mice. The new D2-mdx model with an earlier onset and more pronounced dystrophy phenotype may be useful for evaluating therapies that target cardiac and skeletal muscle function in dystrophin-deficient mice. Our data align the D2-mdx with Duchenne muscular dystrophy patients with the LTBP4 genetic modifier, making it one of the few instances of cross-species genetic modifiers of monogenic traits.


Figures

Figure 1.
Figure 1.
Loss of body mass in the D2-mdx strain was observed independently. Body mass was recorded for all four strains independently at both CNMC (A) and The Jackson Laboratory (B). Results for body weights taken at 28 weeks are shown. Significant differences within the same genetic background are marked with the asterisk symbol. Significant differences between the two mdx strains are marked with the hash symbol. B10-mdx mice were heavier than their B10 wild-type controls as expected. In contrast, the D2-mdx strain was consistently smaller than D2 control. n = 6 mice per group, average ± SEM).
Figure 2.
Figure 2.
D2-mdx mice do not exhibit the hypertrophy that is seen in B10-mdx mice. The TA from each mouse was dissected at 12 weeks and preserved in 4% formalin prior to staining for reticulin (A). Fiber area was then measured for each strain as shown in (B). The plot shows the fiber areas that were ranked by size, averaged and expressed as a percentage of the total fiber sample for each strain: B10, B10-mdx, D2, D2-mdx. Statistical analysis was performed by the Kolmogorov–Smirnov (K–S) two-sample test; B10 versus D2, P = 0.034; B10 versus B10-mdx, P = 0.018; D2 versus D2-mdx, P = 0.341; B10-mdx versus D2-mdx, P = 0.039. n = 4 (B10-mdx and D2-mdx), 6 (B10) and 8 (D2) mice per group.
Figure 3.
Figure 3.
Both mdx strains show similar serum CK profiles. Levels of CK enzyme activity in the serum from all four strains were measured at 28 weeks at CNMC (A) and at 24 weeks at The Jackson Laboratory (B). The results were consistent between the two labs. Serum CK levels for D2-mdx mice were significantly higher than normal baseline levels but on average were lower than the levels seen in B10-mdx mice. n = 8 (B10.mdx), 11 (D2.mdx) and 12 (B10 and D2 controls) mice per group, average ± SEM.
Figure 4.
Figure 4.
D2-mdx show increased levels of EBD uptake compared with B10-mdx. In order to quantify muscle fiber damage, the gastrocnemius and TA muscle were dissected from all four strains of mice at 8 weeks of age. All mice were injected with EBD 24 h prior to being sacrificed. Representative fluorescent cross sections from B10-mdx (A, B) and D2-mdx (C, D) muscles show retained EBD in red and positive myh3 staining in green. EBD absorbance from gastrocnemius lysates was quantified by spectroscopy and normalized to total protein concentration in grams. (E). n = 8 (B10.mdx), 9 (D2.mdx) and 12 (B10 and D2 controls) mice per group, average ± SEM.
Figure 5.
Figure 5.
Loss of grip strength in the D2-mdx strain was observed independently. Forelimb grip strength was recorded for all four strains independently at both CNMC (A) and The Jackson Laboratory (B). Results for grip strength taken at 28 weeks are shown. All grip-strength measurements are normalized to the individual animal's body weight. Both mdx strains were significantly weaker than their wild-type controls. The same trends in forelimb grip strength were also reproducible between labs.
Figure 6.
Figure 6.
D2-mdx mice experience significant muscle weakness at all ages. Force contraction analysis was performed on the freshly dissected EDL muscle of all strains at 7, 28 and 52 weeks at CNMC. Data for the mass of the EDL muscle (A), maximum force generation (B) and specific force generation (C) are shown. The B10-mdx mice showed the expected deficit in specific force generation starting at 28 weeks. However, D2-mdx mice displayed significant muscle weakness both in terms of maximum and specific force generation beginning at the earliest time point. The mass EDL of the D2-mdx mouse was also significantly lower than its wild-type control.
Figure 7.
Figure 7.
D2-mdx mice develop signs of cardiomyopathy earlier than B10-mdx mice. Echocardiography was performed by CNMC at 7, 28 and 52 weeks (A, B) for each mouse strain. The data analysis showed that the D2-mdx mice showed detectable deficits in the EF (A) and shortening fraction (B) starting at 28 weeks, prior to the appearance of any cardiomyopathy in B10-mdx mice. The functional deficits in cardiac function were corroborated by histological results as shown in Figure 8B.
Figure 8.
Figure 8.
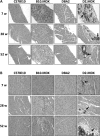
(A) Both mdx strains show inflammation in the diaphragm at all ages. The diaphragm from each mouse was dissected at 7, 28 and 52 weeks and preserved in 4% formalin prior to H&E staining. Tissue histology was normal for the control C57Bl10 and DBA2 strains. The B10-mdx strain showed expected inflammation in the diaphragm. The D2-mdx strain displayed inflammation and calcifications (see indicated examples) in the diaphragm at 7 weeks of age. Calcium deposits were only observed in the diaphragm of D2-mdx mice. (B) D2-mdx mice show signs of cardiomyopathy at 7 weeks of age. The heart from each mouse was dissected at 7, 28 and 52 weeks and preserved in 4% formalin prior to H&E staining. Tissue histology was normal for the control C57Bl10 and DBA2 strains. All images show transverse sections of the left ventricle wall. The B10-mdx did not show signs of cardiomyopathy until 28 weeks. The D2-mdx strain displayed inflammation and calcifications (see indicated examples) in the heart starting at 7 weeks of age. Calcium deposits were only observed in the D2-mdx mice.
Figure 9.
Figure 9.
In vivo optical imaging confirms increased cathepsin activity and inflammation in mdx strains. The cathepsin-mediated cleavage of the ProSense 680 dye serves as a quantifiable marker for inflammation in vivo. Sedated mice were imaged at 7 weeks and 52 weeks of age at CNMC. Cathepsin activity was measured in the fore limbs (A) and in the hind limbs (B). Cathepsin activity was significantly higher in both mdx strains at 7 weeks of age when compared with their respective healthy control strains.
Figure 10.
Figure 10.
D2-mdx mice display significant differences in inflammatory gene expression. We isolated mRNA from frozen TA muscle tissue from 6-week and 52-week-old animals to examine inflammatory gene expression via QRT–PCR. A selection of significantly altered genes is shown in A–F. C57Bl10 mice at 52 weeks were used as a baseline for all calculations of changes in relative gene expression. Both D2-mdx and B10-mdx mice showed the same trends in the expression over time for both soluble cytokines (A–E) and macrophage surface markers (F). Note that the changes in expression in D2-mdx mice are greater in magnitude than those in the B10-mdx mice.
Figure 11.
Figure 11.
D2-mdx mice show a deficiency of central nuclei despite nuclear proliferation in damaged tissues and similar expression of embryonic and neonatal myosin heavy chain subunits, markers of regeneration. Central nuclei are used as markers for successful muscle fiber regeneration. The TA of BrdU-treated animals and prepared for either H&E staining (A, B) or immunofluorescence (C, D). Frozen sections were stained with anti-BrdU (white colored) and anti-laminin (light gray colored). The proportion of centrally nucleated fibers versus healthy uninjured fibers was quantified for all four strains (E). Both mdx-mutant strains possessed significantly more central nucleated fibers than their respective controls. The quantification of BrdU-labeled nuclei showed that both strains had similar numbers of newly proliferated cells (F) but that the D2-mdx mice possessed fewer BrdU-positive central nuclei than B10-mdx mice. Myosin gene expression in the TA was determined for all four strains by QRT–PCR (H). The D2-mdx mice suffered from greater muscle fiber damage than B10-mdx mice as measured by EBD uptake. However, levels of embryonic myosin (myh3) or perinatal myosin (myh8) were comparable between the two mdx strains. E: n = 4 (B10.mdx and D2.mdx), 6 (B10) and 8 (D2) mice per group, average ± SEM, H: n = 3 mice per group, average ± SEM.
Figure 12.
Figure 12.
D2-mdx mice show increased myofiber branching and decrease in myonuclear domain. EDL myofiber isolation and phalloidin staining for DBA/2 and DBA/2-mdx mice at 12 weeks ± 1 week of age (A, B). Both primary and complex fiber branch points were observed with high frequency in D2-mdx mice but not D2 (A,B). Total phalloidin fluorescence per myofiber, as an indicator of myofiber volume, plotted against the number of myonuclei per myofiber, displayed as individual data points for both D2 (n = 3 mice; total of 102 fibers) and D2-mdx (n = 3 mice; total of 108 fibers). (C). Myonuclei per myofiber quantified for D2 and D2-mdx showing significant increase in average number of nuclei per fiber. Plots show the mean with S.D. (T-test, ***P < 0.001) (D). Normalized F-actin per myonuclei quantified showing a decrease in myonuclear domain for D2-mdx compared with controls. Plots show the mean with S.D. (T-test, ***P < 0.001) (E).

References

    1. Hatzipetros T., Bogdanik L.P., Tassinari V.R., Kidd J.D., Moreno A.J., Davis C., Osborne M., Austin A., Vieira F.G., Lutz C. (2014) C57BL/6J congenic Prp-TDP43A315T mice develop progressive neurodegeneration in the myenteric plexus of the colon without exhibiting key features of ALS. Brain Res., 1584, 59–72. - PubMed
    1. Gallagher M.D., Suh E., Grossman M., Elman L., McCluskey L., Van Swieten J.C., Al-Sarraj S., Neumann M., Gelpi E., Ghetti B. (2014) TMEM106B is a genetic modifier of frontotemporal lobar degeneration with C9orf72 hexanucleotide repeat expansions. Acta Neuropathol., 127, 407–418. - PMC - PubMed
    1. Heiman-Patterson T.D., Sher R.B., Blankenhorn E.A., Alexander G., Deitch J.S., Kunst C.B., Maragakis N., Cox G. (2011) Effect of genetic background on phenotype variability in transgenic mouse models of amyotrophic lateral sclerosis: a window of opportunity in the search for genetic modifiers. Amyotroph. Lateral Scler., 12, 79–86. - PubMed
    1. Heydemann A., Ceco E., Lim J.E., Hadhazy M., Ryder P., Moran J.L., Beier D.R., Palmer A.A., McNally E.M. (2009) Latent TGF-β–binding protein 4 modifies muscular dystrophy in mice. J. Clin. Invest., 119, 3703. - PMC - PubMed
    1. Sicinski P., Geng Y., Ryder-Cook A.S., Barnard E.A., Darlison M.G., Barnard P.J. (1989) The molecular basis of muscular dystrophy in the mdx mouse: a point mutation. Science, 244, 1578–1580. - PubMed

Publication types

MeSH terms