. 2016 Jun;27(6):1811-22.
doi: 10.1681/ASN.2015050523. Epub 2015 Nov 13.

B Cell Reconstitution after Rituximab Treatment in Idiopathic Nephrotic Syndrome

Affiliations

B Cell Reconstitution after Rituximab Treatment in Idiopathic Nephrotic Syndrome

Manuela Colucci et al. J Am Soc Nephrol. 2016 Jun.

Abstract

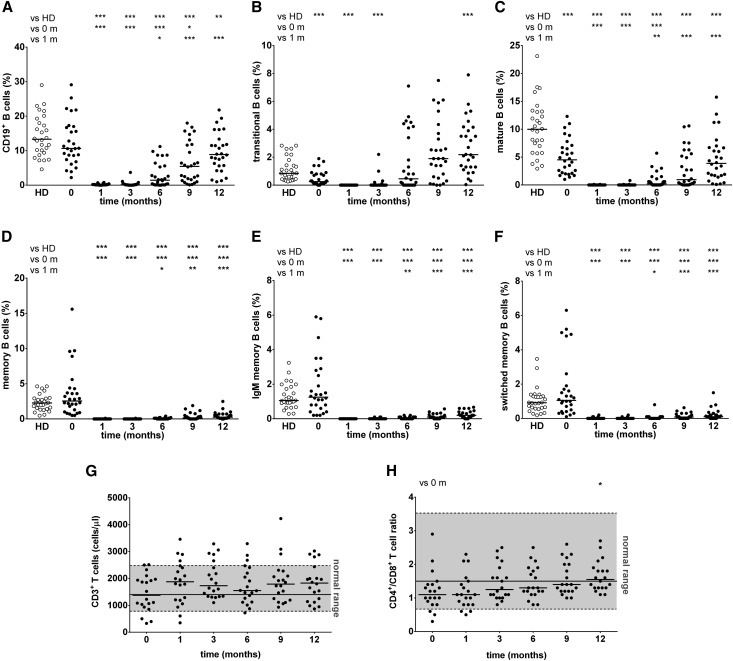
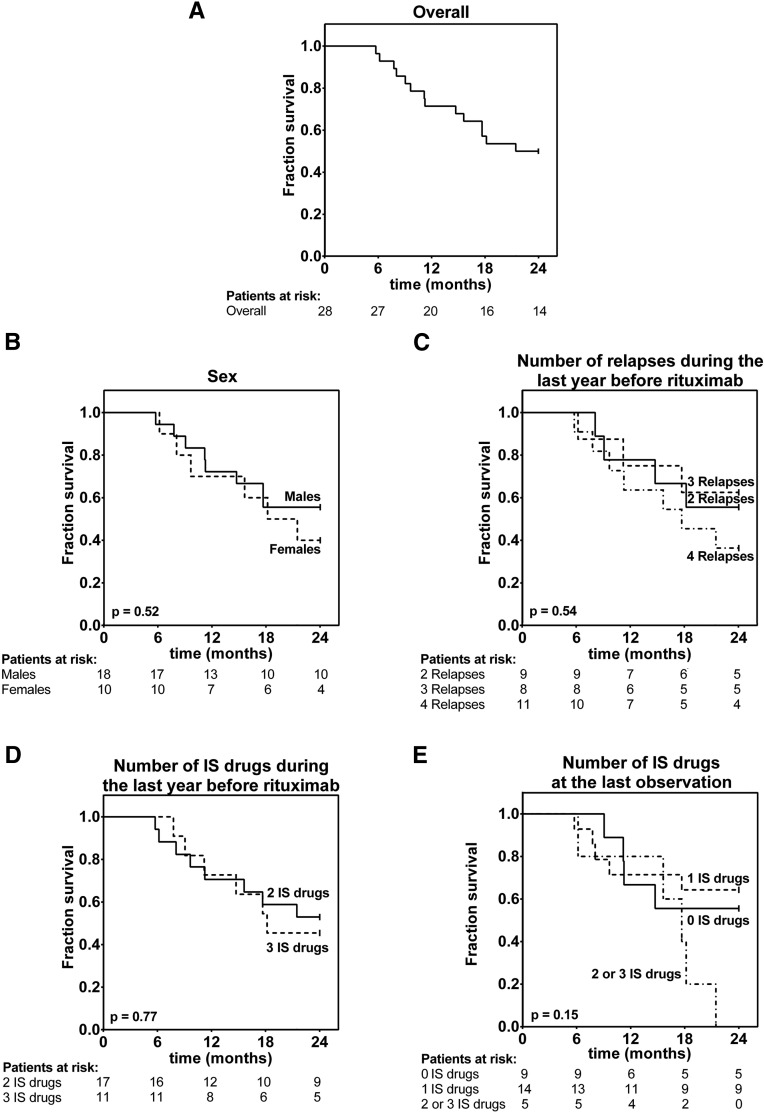
The pathogenesis of nephrotic syndrome is unclear. However, the efficacy of rituximab, a B cell-depleting antibody, in nephrotic syndrome suggests a pathogenic role of B cells. In this retrospective study, we determined by flow cytometry levels of B and T cell subpopulations before and after rituximab infusion in 28 pediatric patients with frequently relapsing or steroid-dependent nephrotic syndrome. At baseline, patients had lower median percentages of transitional and mature B cells than age-matched healthy controls (P<0.001). Rituximab induced full depletion of B cells (<1% of lymphocytes). At 1 year, most patients exhibited complete total and mature B cell recovery, whereas memory B cell subsets remained significantly depleted. Total T cell concentration did not change with rituximab, whereas the CD4(+)/CD8(+) T cell ratio tended to increase. Fourteen patients relapsed within 24 months, with a median follow-up of 11.2 months (interquartile range, 8-17.7 months). We observed no difference at baseline between nonrelapsing and relapsing patients in several clinical parameters and cell subset concentrations. Reconstitution of all memory B cell subpopulations, number of immunosuppressive drugs, and dose of tacrolimus during the last 4 months of follow-up were predictive of relapse in univariate Cox regression analysis. However, only delayed reconstitution of switched memory B cells, independent of immunosuppressive treatment, was protective against relapse in multivariate (P<0.01) and receiver operator characteristic (P<0.01 for percentage of lymphocytes; P=0.02 for absolute count) analyses. Evaluation of switched memory B cell recovery after rituximab may be useful for predicting relapse in patients with nephrotic syndrome.

Keywords: clinical immunology; glomerular disease; idiopathic nephrotic syndrome; immunosuppression; lymphocytes.


Figures

Figure 1.
Figure 1.
RTX treatment affects levels of B and T cell subsets. Multicolor flow cytometry analysis of circulating B and T cell subpopulations at baseline and different time points after RTX treatment in patients with FRNS/SDNS. (A–F) Levels of B cells from patients (n=28) were compared with basal values of age- and sex-matched healthy donors (HDs; n=28). (A) Gated CD19+ B cells were identified on the basis of the expression of surface markers as depicted in Supplemental Figure 1: (B) transitional, (C) mature, (D) memory, (E) IgM memory, and (F) switched memory B cells were expressed as percentages of total lymphocytes. (G and H) T cells from patients (n=20) were compared with the normal range of age-matched controls described by Bofill et al. (G) Gated CD3+ T cells were expressed as absolute numbers of cells per microliter of blood. CD4+ and CD8+ T cells were identified as depicted in Supplemental Figure 1, and (H) the CD4+/CD8+ T cell ratio is represented. Gray areas represent the normal range between the 2.5th and 97.5th percentiles (identified by dashed gray lines), and the bold gray line indicates the normal median. Horizontal lines indicate the medians. Differences with HDs were compared using the nonparametric unpaired Mann–Whitney U test. Levels of B and T cell subpopulations at different time points were analyzed using a nonparametric Friedman test, and pairwise comparisons were evaluated by a Wilcoxon signed–rank test with Bonferroni adjustment versus month 0 (0 m) or versus month 1 (1 m). *P<0.05; **P<0.01; ***P<0.001.
Figure 2.
Figure 2.
Half of patients relapsed within 24 months after RTX treatment. Kaplan–Meier curves describing the relapse-free survival of patients (A) considered as a whole or grouped according to (B) sex, (C) number of relapses, (D) number of immunosuppressive (IS) drugs during the last year before RTX administration, or (E) number of IS drugs at last observation. The number of patients in the different subgroups is indicated every 6 months. Comparison between subgroups was performed using a log-rank test.
Figure 3.
Figure 3.
Concomitant immunosuppressive treatment was tapered or discontinued after RTX administration. (A) Number of patients treated with PDN, MMF, and CNIs up to 12 months post-RTX for all relapsing and nonrelapsing patients regardless of recurrence of NS. (B) Number of patients on immunosuppressive therapy in the 12 months preceding RTX infusion and the last 4 months of the follow-up (months 21–24 for nonrelapsers and before NS recurrence for relapsers). *P<0.05; **P<0.01; ***P<0.001.
Figure 4.
Figure 4.
Memory B cell recovery after RTX treatment was delayed in nonrelapsing patients. The percentage of total lymphocytes for (A) total CD19+, (B) transitional, (C) mature, (D) memory, (E) IgM memory, and (F) switched memory B cells as determined by multicolor flow cytometry at different time points after RTX infusion was compared between relapsers (n=14) and nonrelapsers (n=14). Levels of (G) total CD3+ T cells (expressed as cells per microliter) and (H) CD4+/CD8+ T cell ratio as determined by multicolor flow cytometry at different time points after RTX infusion were compared between relapsers (n=10) and nonrelapsers (n=10). Data are represented as means±SEMs. P values were calculated by comparing values of each cell subpopulation between relapsers and nonrelapsers using an unpaired t test and are indicated on the top of each graph.
Figure 5.
Figure 5.
Switched memory B cell reconstitution after RTX treatment was predictive of the risk of relapse. ROC curve analyzing switched memory B cell values expressed as (A) a percentage of total lymphocytes or (C) cells per microliter at 9 months after RTX infusion and the risk of relapse within 24 months of treatment. The arrow indicates the best cutoff for switched memory B cells (0.067% or 1.65 cells per microliter, respectively). (B and D) Survival analysis comparing patients with delayed (solid lines) and early (dashed lines) recovery of switched memory B cells (log-rank test). AUC, area under the curve.

Comment in

  • Busy Bs.
    Trachtman H. Trachtman H. J Am Soc Nephrol. 2016 Jun;27(6):1584-6. doi: 10.1681/ASN.2015101171. Epub 2015 Nov 30. J Am Soc Nephrol. 2016. PMID: 26620094 Free PMC article. No abstract available.

References

    1. Eddy AA, Symons JM: Nephrotic syndrome in childhood. Lancet 362: 629–639, 2003 - PubMed
    1. Gubler MC: Podocyte differentiation and hereditary proteinuria/nephrotic syndromes. J Am Soc Nephrol 14[Suppl 1]: S22–S26, 2003 - PubMed
    1. Lombel RM, Gipson DS, Hodson EM Kidney Disease: Improving Global Outcomes : Treatment of steroid-sensitive nephrotic syndrome: New guidelines from KDIGO. Pediatr Nephrol 28: 415–426, 2013 - PubMed
    1. Coiffier B: Rituximab therapy in malignant lymphoma. Oncogene 26: 3603–3613, 2007 - PubMed
    1. Boumans MJ, Thurlings RM, Yeo L, Scheel-Toellner D, Vos K, Gerlag DM, Tak PP: Rituximab abrogates joint destruction in rheumatoid arthritis by inhibiting osteoclastogenesis. Ann Rheum Dis 71: 108–113, 2012 - PubMed

Publication types

Supplementary concepts