. 2016 Jan;22(1):32-48.
doi: 10.1261/rna.053710.115. Epub 2015 Nov 13.

An active site rearrangement within the Tetrahymena group I ribozyme releases nonproductive interactions and allows formation of catalytic interactions

Affiliations

An active site rearrangement within the Tetrahymena group I ribozyme releases nonproductive interactions and allows formation of catalytic interactions

Raghuvir N Sengupta et al. RNA. 2016 Jan.

Abstract

Biological catalysis hinges on the precise structural integrity of an active site that binds and transforms its substrates and meeting this requirement presents a unique challenge for RNA enzymes. Functional RNAs, including ribozymes, fold into their active conformations within rugged energy landscapes that often contain misfolded conformers. Here we uncover and characterize one such "off-pathway" species within an active site after overall folding of the ribozyme is complete. The Tetrahymena group I ribozyme (E) catalyzes cleavage of an oligonucleotide substrate (S) by an exogenous guanosine (G) cofactor. We tested whether specific catalytic interactions with G are present in the preceding E•S•G and E•G ground-state complexes. We monitored interactions with G via the effects of 2'- and 3'-deoxy (-H) and -amino (-NH(2)) substitutions on G binding. These and prior results reveal that G is bound in an inactive configuration within E•G, with the nucleophilic 3'-OH making a nonproductive interaction with an active site metal ion termed MA and with the adjacent 2'-OH making no interaction. Upon S binding, a rearrangement occurs that allows both -OH groups to contact a different active site metal ion, termed M(C), to make what are likely to be their catalytic interactions. The reactive phosphoryl group on S promotes this change, presumably by repositioning the metal ions with respect to G. This conformational transition demonstrates local rearrangements within an otherwise folded RNA, underscoring RNA's difficulty in specifying a unique conformation and highlighting Nature's potential to use local transitions of RNA in complex function.

Keywords: RNA catalysis; active site; conformational change; metal ion; noncoding RNA.


Figures

FIGURE 1.
FIGURE 1.
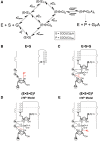
The Tetrahymena group I ribozyme reaction. (A) Framework showing individual steps of the forward reaction (Hougland et al. 2005). The subscripts “O” and “C” refer to complexes in the open and closed states, respectively. The subscript, “chem,” refers to the chemical step of the reaction. The subscript “P” on CCCUCUPA refers to the reactive phosphoryl group. The framework for the reverse reaction (Karbstein et al. 2002) is not shown for simplicity. (BE) Models for active site metal ion interactions within E•G (B), E•S•G (C), and (E•S•G) (D,E). Closed circles and hatched lines represent metal ion interactions and hydrogen bonds, respectively. Partial-negative charges in (E•S•G) (D,E) are represented by “δ.” The absence of an interaction between MC and the G 2′-oxygen atom in E•G is denoted by “X.” In this work, we test whether the 3′-oxygen atom of G contacts a metal ion (M2+) in E•G (B) and MC, as suggested by crystallographic data (Stahley and Strobel 2005), in E•S•G (C) (represented by open circles and “?”). In (E•S•G), structural data (Stahley and Strobel 2005) suggest that the G 3′-oxygen atom contacts MC (D) and biochemical data (Shan et al. 1999a) suggest that this atom interacts with a metal ion distinct from MC, termed MB (E).
FIGURE 2.
FIGURE 2.
Effects of 2′- and 3′-modifications on G binding to (E•S)O, (E•S)C, and (E•P)C. AC correspond to the (E•S•G)O, (E•S•G)C, and (E•P•G)C complexes respectively. The hatched lines correspond to tertiary interactions made between the ribozyme and the P1 duplex with S or P docked into the active site. The scissile phosphoryl group within the (E•S•G)C complex is shaded yellow as is the 3′-hydroxyl group in the (E•P•G)C complex. Kdrel(=KdG/KdGanalog), i.e., Kd for G or AUCG relative to Kd for the G or AUCG analog, was obtained from the data shown in Tables 2 and 3. The dashed line corresponds to Kdrel=1.
FIGURE 3.
FIGURE 3.
MC stabilizes binding of G(2′N) and G(3′N) to the (E•S)C complex. (A) Effects of Mn2+ on the observed equilibrium association constant for binding of G(2′N) (Ka,obsG(2N), •) and G(3′N) (Ka,obsG(3N), •) to (E•S)C at pH 7.7. Data were collected as described in Materials and Methods and are shown in Supplemental Figure S11. The lines are fits of the Mn2+ concentration dependences of Ka,obs for G(2′N) and G(3′N) according to the model shown in B. The y-axes are on different scales to facilitate comparison between the Mn2+ concentration dependence of G(2′N) and G(3′N) binding. (B) Model for binding of the Mn2+ ion that stabilizes binding of G(2′N) and G(3′N) to (E•S)C. and Ka,obsMn report binding of G(2′N) and G(3′N) to (E•S)C in the absence and presence of saturating Mn2+, respectively, and KMn,app(ES)C reports the apparent affinity of the Mn2+ ion that stabilizes binding of G(2′N) and G(3′N). (C) Model of interactions in (E•S•G)C complex. Black circles represent interactions established previously (Shan et al. 1999a, 2001; Shan and Herschlag 1999; Stahley and Strobel 2005) and red circles represent interactions inferred from the data in A.
FIGURE 4.
FIGURE 4.
MA stabilizes binding of G(3′N) to the (E•S)O complex. Effects of Mn2+ on the observed equilibrium association constant for binding of G(3′N) (Ka,obsG(3N)) to (E•S)O at pH 7.7 in a background of 50 mM Mg2+ (A) or 10 mM Mg2+ (B). The solid lines are fits of the Mn2+ concentration dependences of Ka,obsG(3N) according to the model shown in C. The dashed lines correspond to fits of the data with KMn,app(ES)O set to the reported MnA (blue), MnB (green), and MnC (red) affinities to (E•S)O (Shan et al. 1999a, 2001). Values of KMn,app(ES)O for sites A,B, and C are 4.1, 13, and 1.3 mM, respectively, in the presence of 50 mM Mg2+ and 0.82, 7, and 1.3 mM, respectively, in the presence of 10 mM Mg2+ (Shan et al. 1999a). (C) Model for binding of the Mn2+ ion that stabilizes binding of G(3′N) to (E•S)O. Values obtained in a 50 mM (black) and 10 mM (gray) Mg2+ background were obtained from fits of the data from A and B, respectively. Ka,obsMg and Ka,obsMn report binding of G(3′N) to (E•S)O in the absence and presence of saturating Mn2+, respectively, and KMn,app(ES)C reports the apparent affinity of the Mn2+ ion that stabilizes binding of G(3′N) to (E•S)O. (D) Model of interactions in (E•S•G)O complex. Red circles represent interactions inferred from the data in A.
FIGURE 5.
FIGURE 5.
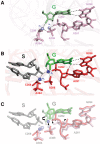
Models for active site interactions within (E•S•G)O and (E•S•G)C. Interactions within (E•S•G)O and (E•S•G)C are shown in A and B, respectively, and an overlay of the two complexes is shown in C. The structures in C are partially transparent to facilitate comparison. The black arrows in C highlight changes in the positions of active site residues in going from (E•S•G)C to (E•S•G)O. The models were obtained through molecular modeling using constraints from the functional data obtained here and in prior work (Materials and Methods; Supplemental Table S1).
FIGURE 6.
FIGURE 6.
Multiple conformational states within the G binding site. Qualitative free energy landscapes of the G binding site within (E•S)O (A), (E•S•G)O (B), and (E•S•G)C (C). (A) There is strong evidence that the open state is not the preferred state at equilibrium (Karbstein and Herschlag 2003) but we do not know whether the splayed and/or collapsed states or an alternative state or ensemble of states is favored (see text). For simplicity, the splayed and collapsed states are reported as the most stable species and are equal in free energy; these states are noted with asterisks. (B) Binding of G (green) stabilizes the open state. G is bound in two distinct conformations, referred to as Gactive, which forms the catalytically relevant interactions, and Ginactive, an inactive form. Structures of these states, obtained from Figure 5, are shown, with G and the active site metal ions colored light blue. Ginactive is the preferred state in (E•S•G)O and is thus lower in free energy (denoted by asterisk). (C) Within (E•S•G)C, S (gray, with the reactive phosphoryl in orange and red) reorganizes the active site so that Gactive is lower in free energy and thus the preferred state (denoted by asterisk).
FIGURE 7.
FIGURE 7.
Model for differential stabilization of S and P docking. Free energy profile for docking of P and S into the active site. Docking of P is 2.3 kcal/mol more stable than docking of S (Narlikar et al. 1995). A scheme for interactions made within each complex is shown below the free energy profile, with dots and hatched lines representing metal ion interactions and hydrogen bonds, respectively. Unfavorable (1–4) and favorable (5–9) interactions made in (E•S•G)C are represented by the upward red arrows and downward green arrows, respectively. The energetic contribution of each of these interactions could not be determined but, for simplicity, the height of each of these arrows is presented as the same. Equilibrium constants for docking (KdockP=600 and KdockS=16) were determined from prior work (Narlikar et al. 1995), the rate constants for docking of S and P was assumed to be the same (∼17 sec−1) (Narlikar et al. 1999), the rate constants for undocking were determined from the ratio kdock/Kdock, and free energy differences were obtained from the rate (k, in units of sec−1) and equilibrium constants (Kdock, unitless) using the standard conversions: ΔG = –RT ln (kh/kBT) and ΔG = –RT ln Kdock, where R = 1.987 cal/(mol•K), T = 323 K (50°C), h = 1.58 × 10⁻³⁴ cal s, and kB = 3.30 × 10⁻²⁴ cal K−1.

Similar articles

Cited by

References

    1. Abramovitz DL, Friedman RA, Pyle AM. 1996. Catalytic role of 2′-hydroxyl groups within a group II intron active site. Science 271: 1410–1413. - PubMed
    1. Adams PL, Stahley MR, Kosek AB, Wang J, Strobel SA. 2004. Crystal structure of a self-splicing group I intron with both exons. Nature 430: 45–50. - PubMed
    1. Aurup H, Tuschl T, Benseler F, Ludwig J, Eckstein F. 1994. Oligonucleotide duplexes containing 2′-amino-2′-deoxycytidines: thermal stability and chemical reactivity. Nucleic Acids Res 22: 20–24. - PMC - PubMed
    1. Banáš P, Hollas D, Zgarbová M, Jurečka P, Orozco M, Cheatham TE, Šponer J, Otyepka M. 2010. Performance of molecular mechanics force fields for RNA simulations: stability of UUCG and GNRA hairpins. J Chem Theory Comput 6: 3836–3849. - PMC - PubMed
    1. Bartley LE, Zhuang X, Das R, Chu S, Herschlag D. 2003. Exploration of the transition state for tertiary structure formation between an RNA helix and a large structured RNA. J Mol Biol 328: 1011–1026. - PubMed

Publication types

LinkOut - more resources