Comparative Study
. 2016 Jan 15;291(3):1289-306.
doi: 10.1074/jbc.M115.673152. Epub 2015 Nov 14.

Structure and Properties of a Non-processive, Salt-requiring, and Acidophilic Pectin Methylesterase from Aspergillus niger Provide Insights into the Key Determinants of Processivity Control

Affiliations
Comparative Study

Structure and Properties of a Non-processive, Salt-requiring, and Acidophilic Pectin Methylesterase from Aspergillus niger Provide Insights into the Key Determinants of Processivity Control

Lisa M Kent et al. J Biol Chem. .

Abstract

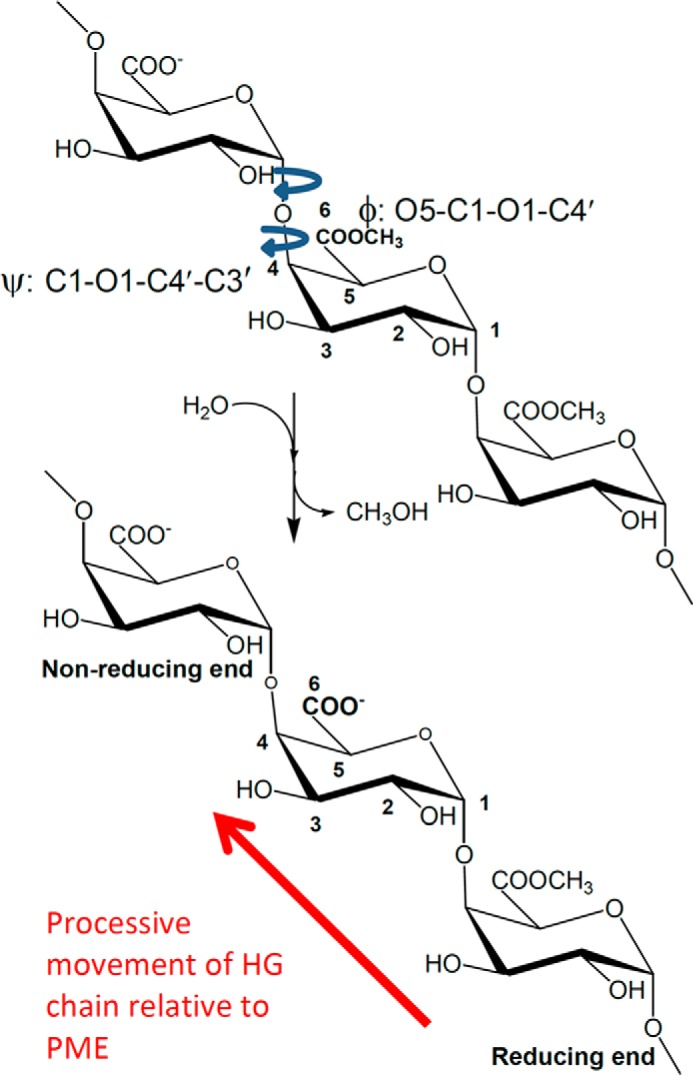
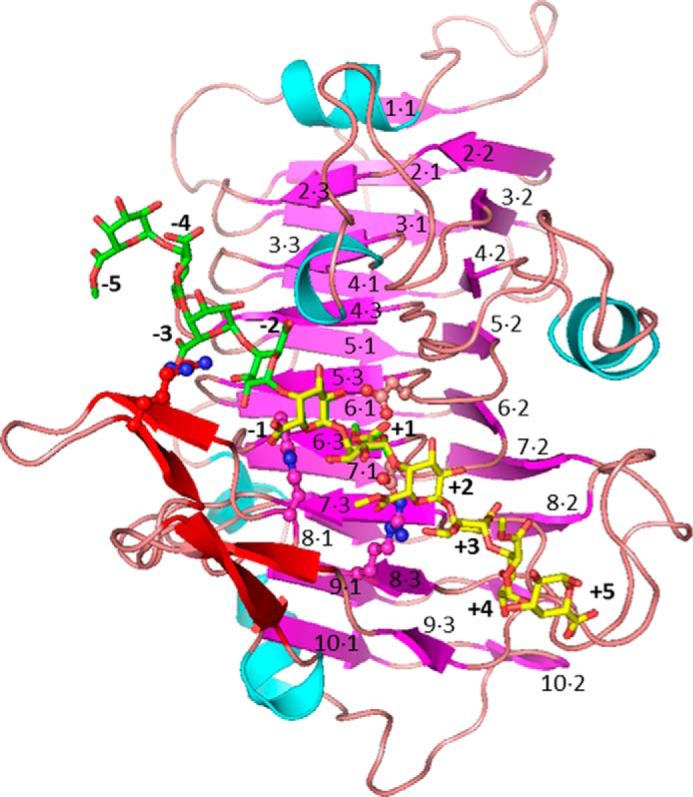
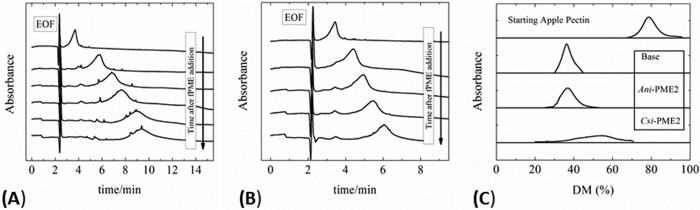
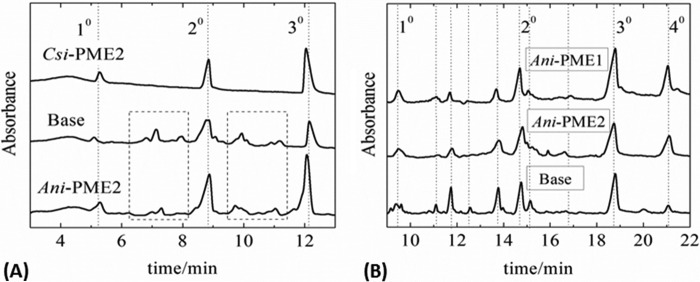
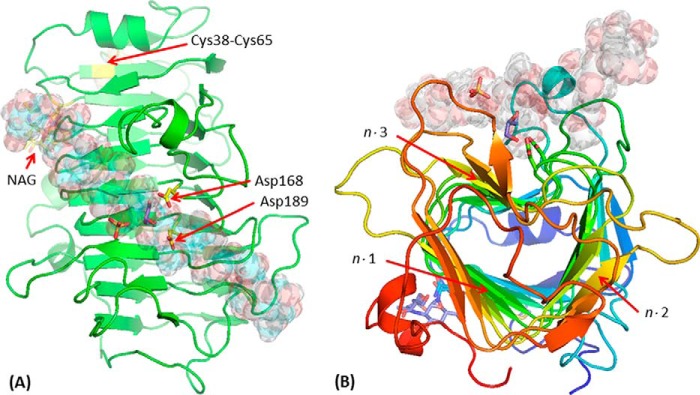
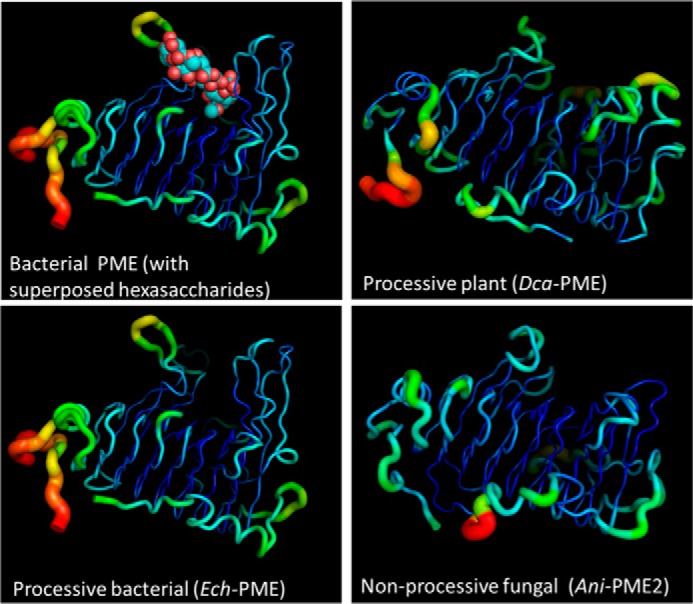
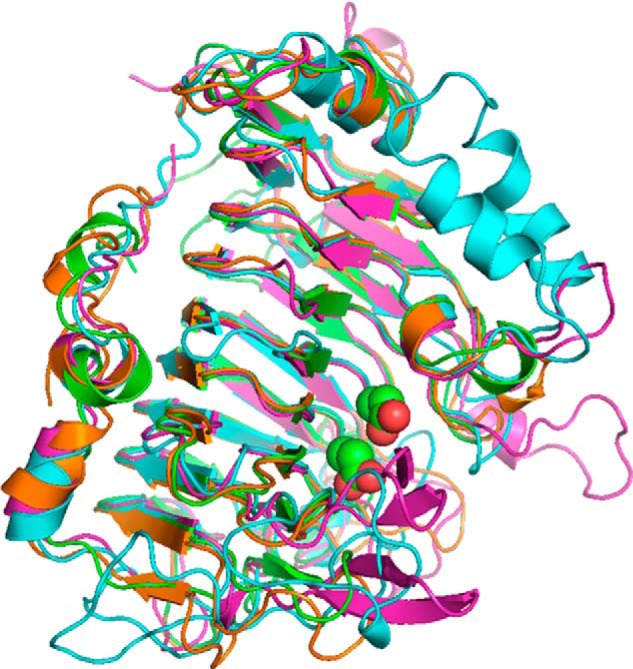
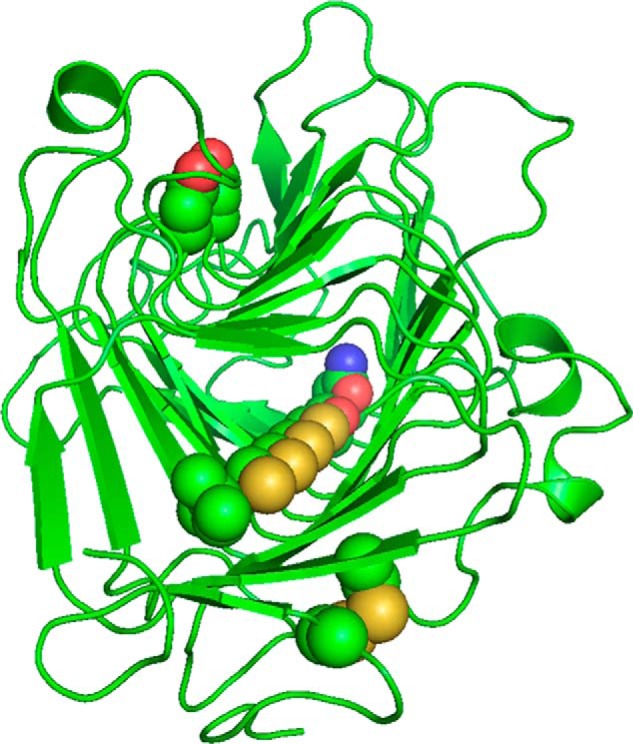
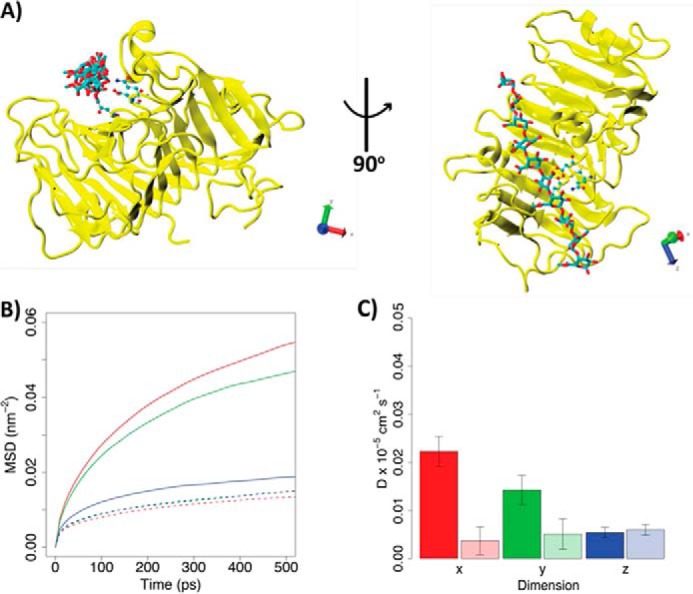
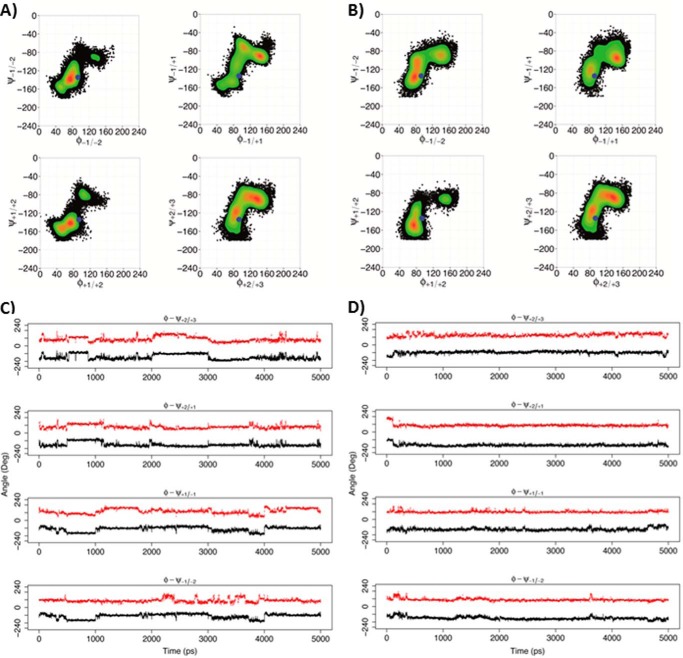
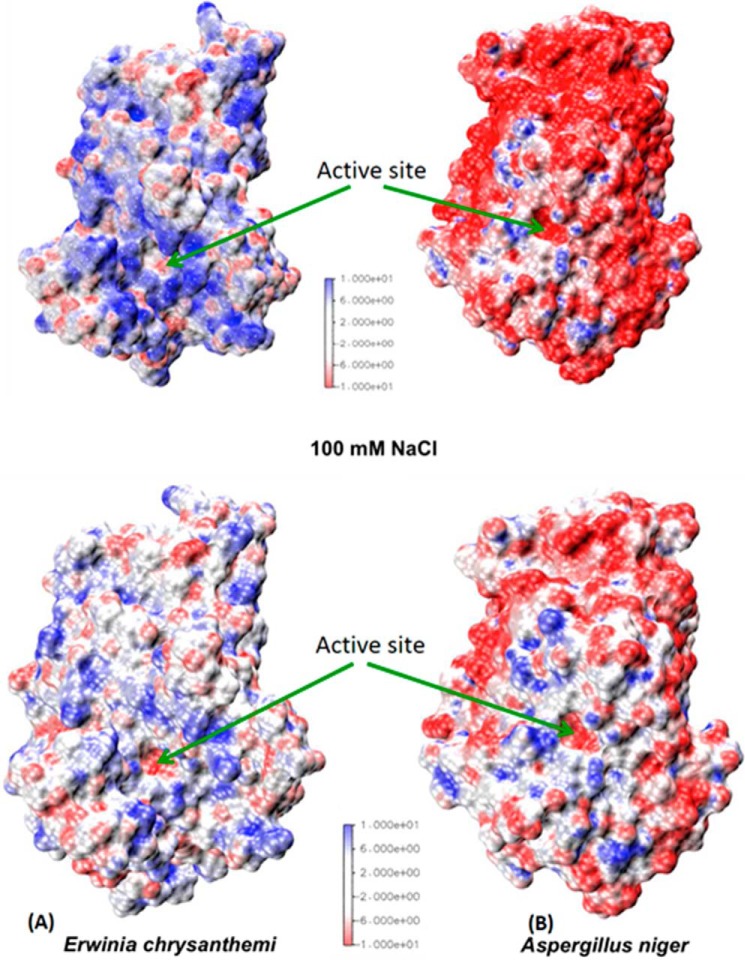
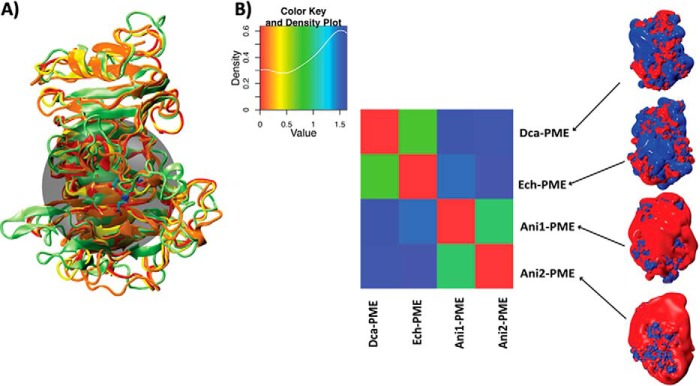
Many pectin methylesterases (PMEs) are expressed in plants to modify plant cell-wall pectins for various physiological roles. These pectins are also attacked by PMEs from phytopathogens and phytophagous insects. The de-methylesterification by PMEs of the O6-methyl ester groups of the homogalacturonan component of pectin, exposing galacturonic acids, can occur processively or non-processively, respectively, describing sequential versus single de-methylesterification events occurring before enzyme-substrate dissociation. The high resolution x-ray structures of a PME from Aspergillus niger in deglycosylated and Asn-linked N-acetylglucosamine-stub forms reveal a 10⅔-turn parallel β-helix (similar to but with less extensive loops than bacterial, plant, and insect PMEs). Capillary electrophoresis shows that this PME is non-processive, halophilic, and acidophilic. Molecular dynamics simulations and electrostatic potential calculations reveal very different behavior and properties compared with processive PMEs. Specifically, uncorrelated rotations are observed about the glycosidic bonds of a partially de-methyl-esterified decasaccharide model substrate, in sharp contrast to the correlated rotations of processive PMEs, and the substrate-binding groove is negatively not positively charged.

Keywords: capillary electrophoresis; carbohydrate processing; crystal structure; electrostatics; molecular dynamics; pectin methylesterase; processivity.


Figures

FIGURE 1.
FIGURE 1.
Hydrolysis (de-methylesterification) of a short homogalacturonan oligomer. For processive PMEs, the direction of de-methylesterification is indicated by the arrow. The reducing and non-reducing ends of the HG oligomer are annotated. The φ and ψ torsion angles linking pairs of residues are shown; the primed atoms belong to the glycolytically linked adjacent residue toward the reducing end of the HG chain.
FIGURE 2.
FIGURE 2.
Adjusted ClustalW alignment of selected PME sequences. The raw sequence-based alignment has been adjusted to show structural alignment, where three-dimensional structural characterization has been made. Residues structurally homologous for fungal, plant, bacterial, and insect PMEs are highlighted in bold capitals; where structural homology is limited to two of the four structures light-face capitals are used. Residues in lowercase are not structurally homologous, and those in italics were not structurally characterized or observed. The secondary structure elements are noted above the pile-up of sequences. The β-helical turns are denoted n (n = 1–10); the strands comprising each turn are appended as n·1, n·2, and n·3; a series of very short β-strands, which form a 5-stranded β-sheet and encompass several active-site residues, are shown in a semi-transparent representation. The active-site Asp and Gln residues are flagged by red arrows; potential N-glycosylation motifs (NX(S/T)) of eukaryotic PMEs are boxed, and the ladder of cysteine and serine/threonine residues are boxed (vertical boxes). For clarity, extended insertions have been excised and the number of missing residues placed in parentheses.
FIGURE 3.
FIGURE 3.
Structure of the PME from E. chrysanthemi. The PME is colored according to secondary structure (magenta for β-strands of the parallel core β-helix, red for non-core β-strands, cyan for helices, and pink for loops). The decasaccharide used for molecular dynamics simulations and formed by combining hexasaccharide oligomers (yellow, methyl-esterified except at the reducing end; green, de-methyl-esterified except at the non-reducing end) is modeled into the binding groove. Note: saccharide residues at −1 and +1 sites are overlapped, and the orientation of the galacturonic acid/methylgalacturonate residues alternates. The labeling scheme for the core parallel β-helix is shown. Key active-site residues are shown as sticks.
SCHEME 1.
SCHEME 1.
Ani-PME2 construct showing vector pYES2 (gray) with insertions including gBlock (bold, with S. cerevisiae consensus sequence AAAAAAATG immediately followed by S. cerevisiae α-mating factor) and Ani-PME2 (beginning with the added Kex cleavage site AAAAGA). Ani-PME2 primers are in italics and utilized restriction sites are underlined.
FIGURE 4.
FIGURE 4.
Capillary electrophoresis of de-methyl-esterified pectin. CE results of de-methylesterification of Fluka apple pectin in 50 mm acetate buffer at pH 4.2 containing 100 mm NaCl by Ani-PME2 (glycosylated) (A) and Ani-PME2 (EndoHf-treated) (B). The pectin peak (carboxyl group absorbance at 192 nm) moves to the right as its negative charge density increases. (The large spike at around 2 min results from the electro-osmotic flow.) C, capillary electrophoresis of batch de-methyl-esterified of pectin. Pectin was de-methyl-esterified to generate substrates of similar degree (35%) of methylesterification (DM), maintaining pH at a constant value by titration with 0.10 m NaOH solution. Orange PME (Csi-PME at pH 7.5), Ani-PME2 (at pH 4.5), and base (at pH 11.5) were used to de-methyl-esterify 0.5% w/v apple pectin. The degree of methylesterification and the molecular distribution were obtained by CE.
FIGURE 5.
FIGURE 5.
Capillary electrophoresis of EndoHf-digested partly de-methyl-esterified pectin. A, CE of apple pectin samples digested with EndoPG II and run with 50 mm background electrolyte at 20 kV applied voltage. Highly methyl-esterified apple pectin has first been treated with strong base (labeled Base), Csi-PME, or Ani-PME2 to a constant degree of methylesterification of ∼35%. EndoPG II digestion of the de-methyl-esterified sample obtained by using Csi-PME produces only mono-, di-, and tri-galacturonic acid fragments of upon digestion with EndoPG II. For the base-generated and Ani-PME2-treated substrate, both of similar DM, however, many more fragments (see dotted boxes) can be identified as being partially methyl-esterified oligogalacturonides, consistent with the more random placement of the unmethyl-esterified residues by base or Ani-PME2. B, capillary electrophoresis of EndoHf-digested partly de-methyl-esterified pectin. CE of apple pectin samples digested with EndoPG II and run with 100 mm phosphate running buffer at 30 kV applied voltage. Highly methyl-esterified apple pectin was first treated with strong base (labeled Base) or glycosylated Ani-PME2, or Ani-PME1 to a constant degree of methylesterification of ∼40%. Unmethyl-esterified peaks are labeled, and additional peaks corresponding to methyl-esterified fragments appearing in all three digests are indicated by dotted lines (101).
FIGURE 6.
FIGURE 6.
Structure of EndoHf-treated Ani-PME2. The active-site Asp residues (here Asp-168 and Asp-189) are highlighted in a ball-and-stick representation (carbon atoms in yellow); the disordered NAG stub is similarly highlighted (carbon atoms in yellow). Other atoms, including those of a sulfate and a glycerol near the active site, and the disulfide bridge Cys-38–Cys-65, are in standard CPK coloring. A decasaccharide (de-methyl-esterified for residues labeled −5, −4, −3, −2, −1, and +1 and methyl-esterified for residues +2, +3, +4, and +5) is modeled in the binding groove and shown in semi-transparent form. A, view looking down on the active site. Note that the carboxylate group of the decasaccharide residue at the site −1 coincides closely with one of the sulfate anions, and a glycerol is located close to the active-site aspartate residues. B, view looking approximately down the β-helix axis of Ani-PME2, rainbow colored from the N terminus in blue to the C terminus in red. The n·m faces of the β-helix are labeled (helix turn n = 1–12; face m = 1–3).
FIGURE 7.
FIGURE 7.
Flexibility of Ani-PME2 reported by crystallographic atomic displacement parameters (B values). “Putty” diagrams (PyMOL) of the relative atomic displacement parameters, in rainbow colors, for two processive plant and bacterial PMEs and for the non-processive fungal PME, Ani-PME2. The largest atomic displacement parameters are colored red; the smallest dark blue. The top left frame shows the decasaccharide derived from superposition of two hexasaccharides (PDB codes 2nsp and 2ntp). Note that the loops surrounding the substrate-binding groove are relatively inflexible in all structures, notwithstanding greatly varying lengths, and note the absence of bound oligosaccharide in the case of Dca-PME and Ani-PME.
FIGURE 8.
FIGURE 8.
Schematic representation of the superposition of PME structures. The PME2 from A. niger is shown in green, D. carota in orange (PDB code 1gq8), rice weevil (Sitophilus oryzae) in cyan (PDB code 4pmh), and E. chrysanthemi in magenta (PDB codes 2nt6 and 2nt9). The active-site Asp residues are shown as spheres. Relative to Fig. 6A, the view here is rotated ∼90° anti-clockwise about an axis running south-north. The N and C termini of the rice weevil PME are cyan-highlighted; the others are shown in black.
FIGURE 9.
FIGURE 9.
Cysteine ladder comprising Cys-161, Cys-182, Cys-202, and Cys-231. These Cys and Ser-262 share a common orientation and lie in the turn between β-helix faces n·1 and n·2. The Asn and Ile bookends are shown. Also shown are the Cys-38–Cys-64 disulfide bridge and the active-site aspartate residues, Asp-168 and Asp-189. For clarity, residues 49–57 are omitted.
FIGURE 10.
FIGURE 10.
Diffusion of HG decasaccharide (X5XM4) docked into the binding grooves of processive Ani-PME2 and processive Ech-PME. A, structure of Ani-PME2 in complex with the X5XM4 decasaccharide modeled into the enzyme binding groove. Ani-PME2 is colored in yellow, and the oligosaccharide is shown in licorice and colored by atom type. The binding of X5XM4 to Ech-PME is generally similar and is shown in Ref. . The Cartesian axes show the alignment of the oligosaccharide along the z-dimension. B, mean-square displacements of the oligosaccharide during the first 500 ps from the start of the simulation in the x (red), y (green), and z (blue) dimensions. The solid line refers to Ani-PME2; the dotted line shows Ech-PME. The mean-square displacement in the z direction is very similar for both enzymes. C, diffusion coefficients calculated from the fitting of the mean-square displacements shown in B between 100 and 400 ps. Diffusion coefficients describe the movements of the oligosaccharide along the x (red), y (green), and z (blue) dimensions. The z-direction represents the direction of oligosaccharide sliding in the case of a processive activity. The fully colored boxes refer to Ani-PME2; the pale-shaded boxes show Ech-PME. The diffusion of the oligosaccharide is markedly greater in the x-direction, away from the substrate-binding groove, for the non-processive Ani-PME2 than for the processive Ech-PME.
FIGURE 11.
FIGURE 11.
Rotations around the glycosidic linkages for the X5XM4 substrate. A and C, non-processive Ani-PME2. B and D, processive Ech-PME. A and B, φ/ψ dihedral angles for glycosidic linkages +2/+3, +2/+1, +1/−1, and −1/−2, where +1 is the residue X at the active site (+1). The φ and ψ angles are defined, respectively, as O5-C1-O1-C4′ and C1-O1-C4′-C3′ (see Fig. 1). The blue dots mark the starting point for the MD simulations. The scale on the right reports the relative probability of the φ/ψ values sampled during the MD simulations. C, plot of φ (red) and ψ (black) dihedral angles as a function of time for the non-processive Ani-PME2, showing uncorrelated and non-concerted rotations. D, plot of φ (red) and ψ (black) dihedral angles as a function of time for the processive Ech-PME, showing correlated and concerted rotations. The plots in B and D were obtained from the MD trajectories as published previously (74).
FIGURE 12.
FIGURE 12.
Comparison of surface electrostatic potentials at pH 7. 4. A, Ech-PME. B, Ani-PME2 at 0 mm NaCl (top frames) and 100 mm NaCl (bottom frames). The color scale is in multiples of kBT/e (T = 298.15 K). The electrostatic potential for Dca-PME is similar to that for Ech-PME.
FIGURE 13.
FIGURE 13.
Comparison of the electrostatic potentials for processive and non-processive PMEs. A, structural alignment of the PMEs from D. carota (Dca-PME, orange, PDB code 1gq8), E. chrysanthemi (Ech-PME, light green, PDB code 2nt6 and 2nt9), A. niger isoform 1 (Ani-PME1, red, homology-modeled structure), and A. niger isoform 2 (Ani-PME2, yellow). The transparent black sphere, centered on atom OD2 atom of Ech-PME Asp-199 and having a radius of 15 Å, shows the region chosen for the quantitative comparison of the electrostatic potentials. B, diagonalized matrix colored according to similarity indices calculated for the comparison of the electrostatic potentials of the PMEs shown in A. The color plot and the co-respective values of the similarity index are reported in the inset above. In the right-hand panel, the electrostatic potential densities of the four analyzed PMEs are shown and colored between −1 (red) and +1 kBT/e.

References

    1. Atmodjo M. A., Hao Z., and Mohnen D. (2013) Evolving views of pectin biosynthesis. Annu. Rev. Plant Biol. 64, 747–779 - PubMed
    1. Caffall K. H., and Mohnen D. (2009) The structure, function, and biosynthesis of plant cell wall pectic polysaccharides. Carbohydr. Res. 344, 1879–1900 - PubMed
    1. Mohnen D. (2008) Pectin structure and biosynthesis. Curr. Opin. Plant Biol. 11, 266–277 - PubMed
    1. Markovic O., and Janecek S. (2004) Pectin methylesterases: sequence-structural features and phylogenetic relationships. Carbohydr. Res. 339, 2281–2295 - PubMed
    1. Albersheim P., Darvill A., Roberts K., Sederoff R., and Staehelin A. (2010) Plant Cell Walls: From Chemistry to Biology, Garland Science, New York

Publication types

MeSH terms