. 2016 Jan;96(1):4-15.
doi: 10.1038/labinvest.2015.131. Epub 2015 Nov 16.

Intra-tumor genetic heterogeneity in rectal cancer

Affiliations

Intra-tumor genetic heterogeneity in rectal cancer

Karin M Hardiman et al. Lab Invest. 2016 Jan.

Abstract

Colorectal cancer arises in part from the cumulative effects of multiple gene lesions. Recent studies in selected cancer types have revealed significant intra-tumor genetic heterogeneity and highlighted its potential role in disease progression and resistance to therapy. We hypothesized the existence of significant intra-tumor genetic heterogeneity in rectal cancers involving variations in localized somatic mutations and copy number abnormalities. Two or three spatially disparate regions from each of six rectal tumors were dissected and subjected to the next-generation whole-exome DNA sequencing, Oncoscan SNP arrays, and targeted confirmatory sequencing and analysis. The resulting data were integrated to define subclones using SciClone. Mutant-allele tumor heterogeneity (MATH) scores, mutant allele frequency correlation, and mutation percent concordance were calculated, and copy number analysis including measurement of correlation between samples was performed. Somatic mutations profiles in individual cancers were similar to prior studies, with some variants found in previously reported significantly mutated genes and many patient-specific mutations in each tumor. Significant intra-tumor heterogeneity was identified in the spatially disparate regions of individual cancers. All tumors had some heterogeneity but the degree of heterogeneity was quite variable in the samples studied. We found that 67-97% of exonic somatic mutations were shared among all regions of an individual's tumor. The SciClone computational method identified 2-8 shared and unshared subclones in the spatially disparate areas in each tumor. MATH scores ranged from 7 to 41. Allele frequency correlation scores ranged from R(2)=0.69-0.96. Measurements of correlation between samples for copy number changes varied from R(2)=0.74-0.93. All tumors had some heterogeneity, but the degree was highly variable in the samples studied. The occurrence of significant intra-tumor heterogeneity may allow selected tumors to have a genetic reservoir to draw from in their evolutionary response to therapy and other challenges.


Figures

Figure 1
Figure 1
Allele frequencies of coding variants in each tumor and sample in six rectal cancers. Mutations that failed validation with Ion Torrent were not included. Red indicates genes listed as significant in TCGA colorectal cancer paper. Yellow indicates high impact mutations: frameshift, splice site, and stop codons. Blue indicates synonymous mutations. Black indicates the mutation was not found in that sample. S: Sample
Figure 2
Figure 2
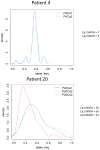
A. Estimated probability density of allele frequency for variants from different samples vs density for Patient 4 and Patient 20. Each sample is plotted as a different color.
Figure 3
Figure 3
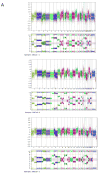
Intra-tumor Heterogeneity in Copy Number Changes A: Heterogeneity in Copy Number Changes in 3 samples from Tumor 20. B. Tumor 20 shows heterogeneity in chromosome 3, in which regions of the p and q arms vary between states of allelic balance and imbalance across the three samples, as evidenced by characteristic three band or four band patterns in the BAF plots.
Figure 3
Figure 3
Intra-tumor Heterogeneity in Copy Number Changes A: Heterogeneity in Copy Number Changes in 3 samples from Tumor 20. B. Tumor 20 shows heterogeneity in chromosome 3, in which regions of the p and q arms vary between states of allelic balance and imbalance across the three samples, as evidenced by characteristic three band or four band patterns in the BAF plots.
Figure 4
Figure 4
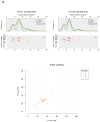
SciClone plots: A. Tumor 1, Variant Allele Frequency (VAF) is plotted against density and the copy number 2 variants are identified along the green line. Then VAF is plotted against tumor coverage (depth) for the 2 samples from tumor 1 for variants found in the diploid portion of the samples and subclones are defined by different colors. VAF’s for each sample are then plotted against each other in the diploid portion to reveal the relationship between the multiple clusters (subclones). B. Tumor 11; Tumor 11, Variant Allele Frequency (VAF) is plotted against density and the copy number 2 variants are identified along the green line. Then VAF is plotted against tumor coverage (depth) for the 3 samples from tumor 11 for variants found in the diploid portion of the samples and subclones are defined by different colors. VAF’s for each sample are then plotted against each other in the diploid portion to reveal the relationship between the multiple clusters (subclones).
Figure 4
Figure 4
SciClone plots: A. Tumor 1, Variant Allele Frequency (VAF) is plotted against density and the copy number 2 variants are identified along the green line. Then VAF is plotted against tumor coverage (depth) for the 2 samples from tumor 1 for variants found in the diploid portion of the samples and subclones are defined by different colors. VAF’s for each sample are then plotted against each other in the diploid portion to reveal the relationship between the multiple clusters (subclones). B. Tumor 11; Tumor 11, Variant Allele Frequency (VAF) is plotted against density and the copy number 2 variants are identified along the green line. Then VAF is plotted against tumor coverage (depth) for the 3 samples from tumor 11 for variants found in the diploid portion of the samples and subclones are defined by different colors. VAF’s for each sample are then plotted against each other in the diploid portion to reveal the relationship between the multiple clusters (subclones).

References

    1. Siegel R, Naishadham D, Jemal A. Cancer statistics, 2012. CA Cancer J Clin. 2012 Jan-Feb;62(1):10–29. - PubMed
    1. van Gijn W, Marijnen CA, Nagtegaal ID, Kranenbarg EM, Putter H, Wiggers T, et al. Preoperative radiotherapy combined with total mesorectal excision for resectable rectal cancer: 12-year follow-up of the multicentre, randomised controlled TME trial. Lancet Oncol. 2011 Jun;12(6):575–82. - PubMed
    1. Habr-Gama A, de Souza PM, Ribeiro U, Jr, Nadalin W, Gansl R, Sousa AH, Jr, et al. Low rectal cancer: impact of radiation and chemotherapy on surgical treatment. Dis Colon Rectum. 1998 Sep;41(9):1087–96. - PubMed
    1. Garcia-Aguilar J, Hernandez de Anda E, Sirivongs P, Lee SH, Madoff RD, Rothenberger DA. A pathologic complete response to preoperative chemoradiation is associated with lower local recurrence and improved survival in rectal cancer patients treated by mesorectal excision. Dis Colon Rectum. 2003 Mar;46(3):298–304. - PubMed
    1. Garcia-Aguilar J, Chen Z, Smith DD, Li W, Madoff RD, Cataldo P, et al. Identification of a biomarker profile associated with resistance to neoadjuvant chemoradiation therapy in rectal cancer. Ann Surg. 2011 Sep;254(3):486–92. discussion 92–3. - PMC - PubMed

Publication types