. 2015 Nov 16:5:16645.
doi: 10.1038/srep16645.

MR-PheWAS: hypothesis prioritization among potential causal effects of body mass index on many outcomes, using Mendelian randomization

Affiliations

MR-PheWAS: hypothesis prioritization among potential causal effects of body mass index on many outcomes, using Mendelian randomization

Louise A C Millard et al. Sci Rep. .

Abstract

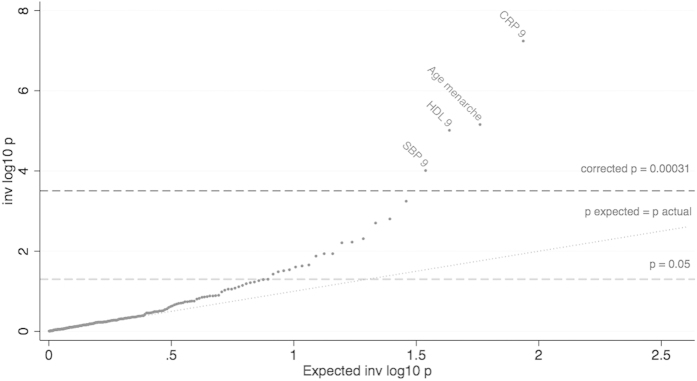
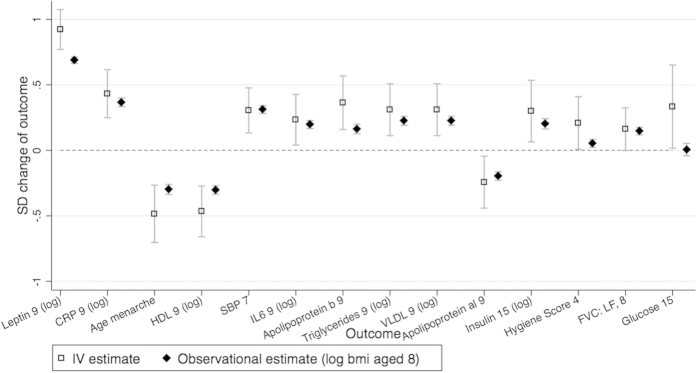
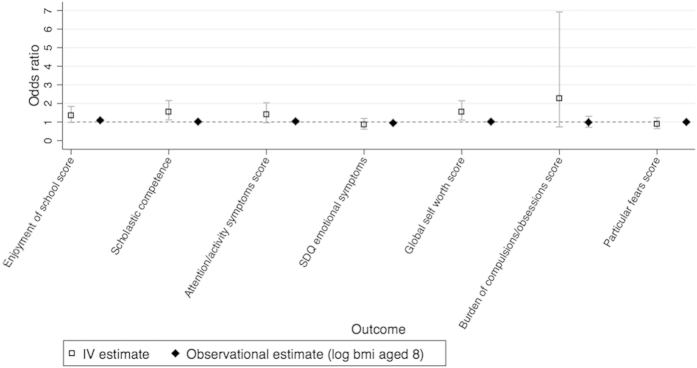
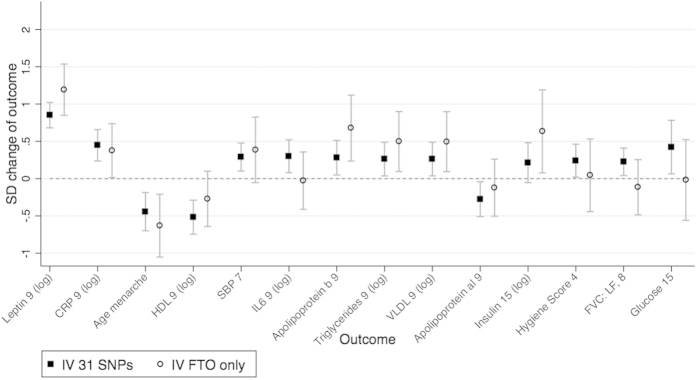
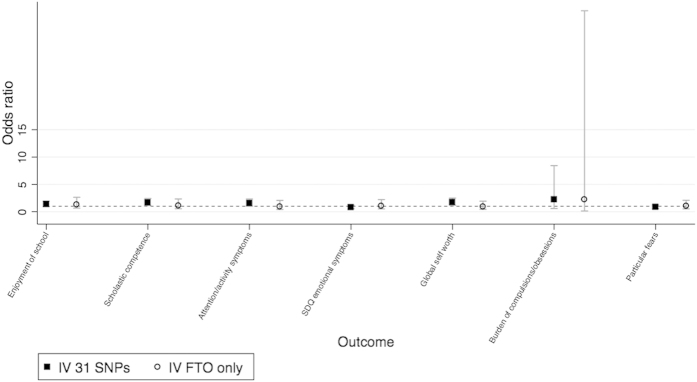
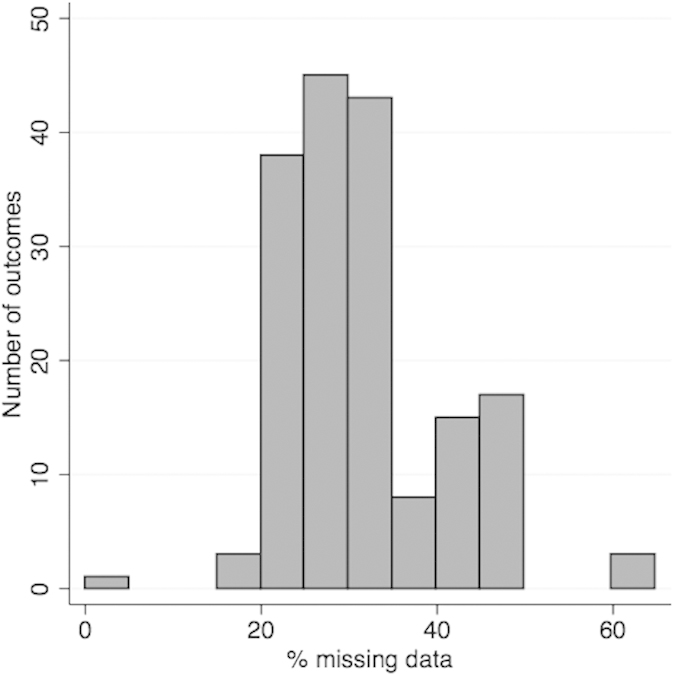
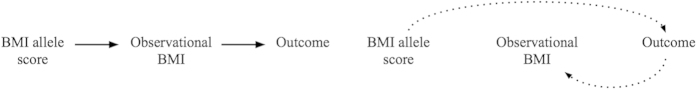
Observational cohort studies can provide rich datasets with a diverse range of phenotypic variables. However, hypothesis-driven epidemiological analyses by definition only test particular hypotheses chosen by researchers. Furthermore, observational analyses may not provide robust evidence of causality, as they are susceptible to confounding, reverse causation and measurement error. Using body mass index (BMI) as an exemplar, we demonstrate a novel extension to the phenome-wide association study (pheWAS) approach, using automated screening with genotypic instruments to screen for causal associations amongst any number of phenotypic outcomes. We used a sample of 8,121 children from the ALSPAC dataset, and tested the linear association of a BMI-associated allele score with 172 phenotypic outcomes (with variable sample sizes). We also performed an instrumental variable analysis to estimate the causal effect of BMI on each phenotype. We found 21 of the 172 outcomes were associated with the allele score at an unadjusted p < 0.05 threshold, and use Bonferroni corrections, permutation testing and estimates of the false discovery rate to consider the strength of results given the number of tests performed. The most strongly associated outcomes included leptin, lipid profile, and blood pressure. We also found novel evidence of effects of BMI on a global self-worth score.


Figures

Figure 1
Figure 1. QQ-plot of the associations between the BMI allelic score and the 172 outcomes.
Association of log BMI age 8 with outcomes, of the stage 1 tests. Using the original dataset with variable number of individuals for each outcome. Tests performed with the Stata regress command and robust option. Top result leptin is not shown as P value too small. Corrected P = 0.00023 line: The Bonferroni corrected P = 0.05, accounting for the 160 tests (excluding validation set) performed. P expected = actual line: The expected trajectory, assuming the P values are uniformly distributed.
Figure 2
Figure 2. A comparison of the observational and instrumental variable estimates for continuous outcomes.
The standard deviation change of outcome for a 1 SD increase of log BMI aged 8. IV estimate of effect using two-stage least squares regression of log BMI at age 8 as the exposure, with robust option. Observational estimates are the SD change of the outcome for a 1 SD increase in log BMI at age 8. Graphical illustration of the results in Table 4.
Figure 3
Figure 3. A comparison of the observational and instrumental variable estimates for binary outcomes.
Odds ratio between groups of outcomes, for a 1 SD change of log BMI aged 8. IV estimate of effect using two-stage least squares regression of log BMI at age 8 as the exposure, with robust option. Observational estimates are the odds ratio between outcome groups. Graphical illustration of the results in Table 4. Categories for binary variables given in Supplementary Table 7.
Figure 4
Figure 4. Testing invalidity of IV assumptions: associations of two instrumental variables using distinct SNP subsets, for continuous outcomes.
Comparison between the SNP subsets: (1) 31 SNPs (excluding FTO SNP) and (2) the FTO SNP only. IV estimate of effect using two-stage least squared regression of log BMI at age 8 as the exposure. Graphical illustration of the results in Table 5.
Figure 5
Figure 5. Testing invalidity of IV assumptions: associations of two instrumental variables using distinct SNP subsets, of binary outcomes.
Odds ratio between outcome groups, for a 1 SD change of log BMI aged 8. Comparison between the SNP subsets: (1) 31 SNPs (excluding FTO SNP) and (2) the FTO SNP only. IV estimate of effect using two-stage least squared regression of log BMI at age 8 as the exposure. Graphical illustration of the results in Table 5. Categories for binary variables are given in Supplementary Table 7.
Figure 6
Figure 6. Distribution of the percentage of missing data, in our 8,121 sample, across the 172 outcomes.
Figure 7
Figure 7. Graphs illustrating two possible causal pathways to explain associations of the BMI allele score with the outcomes.
Abbreviations: BMI, body mass index. Left graph represents the intended pathway we have investigated, where the BMI allele score is an IV for BMI and the variants affect the outcome solely through observed BMI in childhood. The right graph represents the alternative causal pathway, where the allelic score affects BMI indirectly through the outcome variable. It is possible that these two pathways both occur for a given outcome, such that the graph would become cyclical.

References

    1. Cardon L. R. & Bell J. I. Association study designs for complex diseases. Nature Reviews Genetics 2, 91–99, 10.1038/35052543 (2001). - DOI - PubMed
    1. Colhoun H. M., McKeigue P. M. & Davey Smith G. Problems of reporting genetic associations with complex outcomes. Lancet 361, 865–872, 10.1016/S0140-6736(03)12715-8 (2003). - DOI - PubMed
    1. McCarthy M. I. et al. Genome-wide association studies for complex traits: consensus, uncertainty and challenges. Nature reviews. Genetics 9, 356–369, 10.1038/nrg2344 (2008). - DOI - PubMed
    1. Hindorff L. A. et al. Potential etiologic and functional implications of genome-wide association loci for human diseases and traits. P Natl Acad Sci USA 106, 9362–9367, 10.1073/Pnas.0903103106 (2009). - DOI - PMC - PubMed
    1. Davey Smith G. & Ebrahim S. Epidemiology--is it time to call it a day? International journal of epidemiology 30, 1–11, 10.1093/ije/30.1.1 (2001). - DOI - PubMed

Publication types

LinkOut - more resources