

Using de novo protein structure predictions to measure the quality of very large multiple sequence alignments
- PMID: 26568625
- PMCID: PMC5939968
- DOI: 10.1093/bioinformatics/btv592
Using de novo protein structure predictions to measure the quality of very large multiple sequence alignments
Abstract
Motivation: Multiple sequence alignments (MSAs) with large numbers of sequences are now commonplace. However, current multiple alignment benchmarks are ill-suited for testing these types of alignments, as test cases either contain a very small number of sequences or are based purely on simulation rather than empirical data.
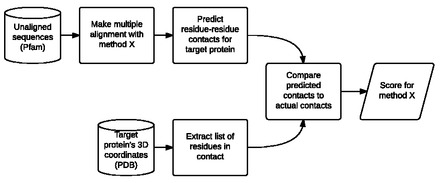
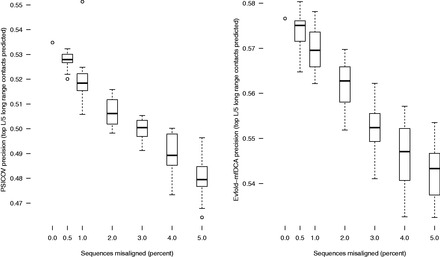
Results: We take advantage of recent developments in protein structure prediction methods to create a benchmark (ContTest) for protein MSAs containing many thousands of sequences in each test case and which is based on empirical biological data. We rank popular MSA methods using this benchmark and verify a recent result showing that chained guide trees increase the accuracy of progressive alignment packages on datasets with thousands of proteins.
Availability and implementation: Benchmark data and scripts are available for download at http://www.bioinf.ucd.ie/download/ContTest.tar.gz
Contact: des.higgins@ucd.ie
Supplementary information: Supplementary data are available at Bioinformatics online.
© The Author 2015. Published by Oxford University Press.
Figures

References
-
- Carlson M., et al. (n.d.) PFAM.db: A Set of Protein ID Mappings for PFAM. R package version 3.1.2. http://bioconductor.org/packages/release/data/annotation/html/PFAM.db.html.
MeSH terms
Substances
LinkOut - more resources
Full Text Sources
Other Literature Sources
