. 2015 Dec;21(12):1455-63.
doi: 10.1038/nm.3990. Epub 2015 Nov 16.

Dystrophin expression in muscle stem cells regulates their polarity and asymmetric division

Affiliations

Dystrophin expression in muscle stem cells regulates their polarity and asymmetric division

Nicolas A Dumont et al. Nat Med. 2015 Dec.

Abstract

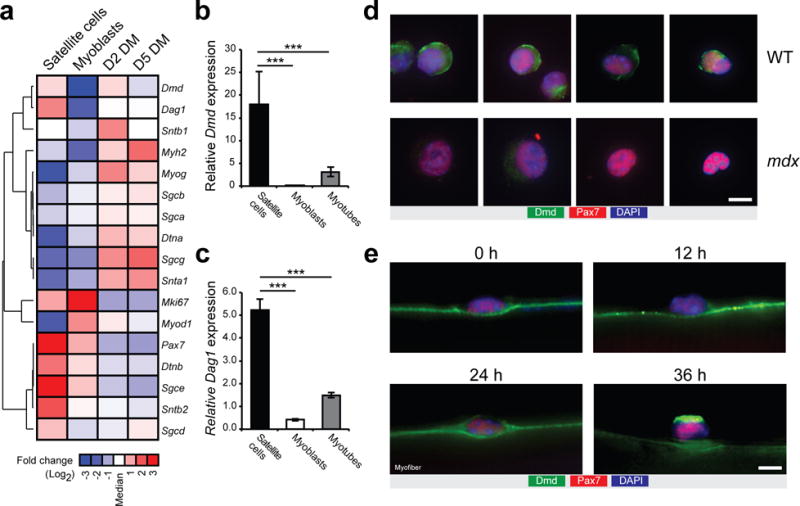
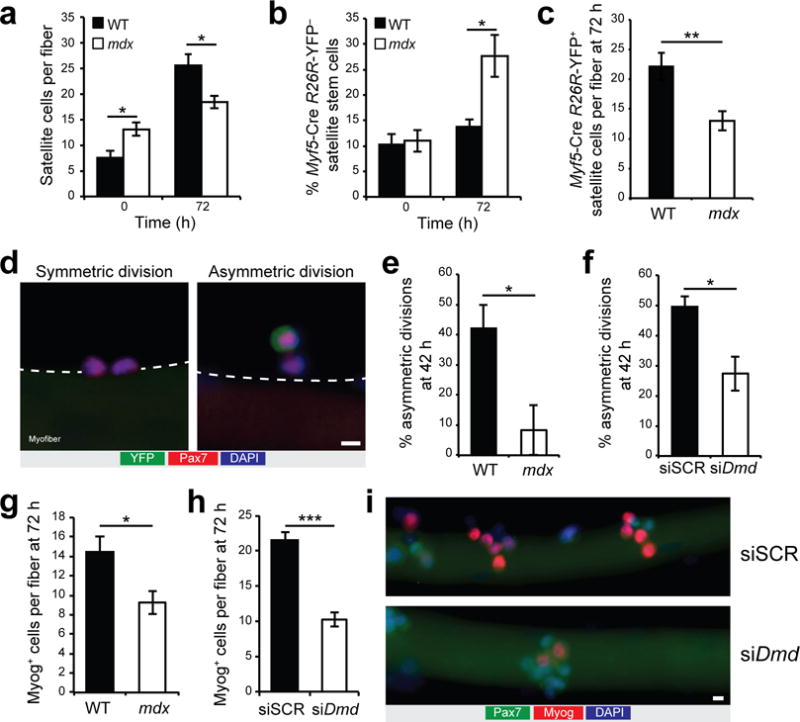
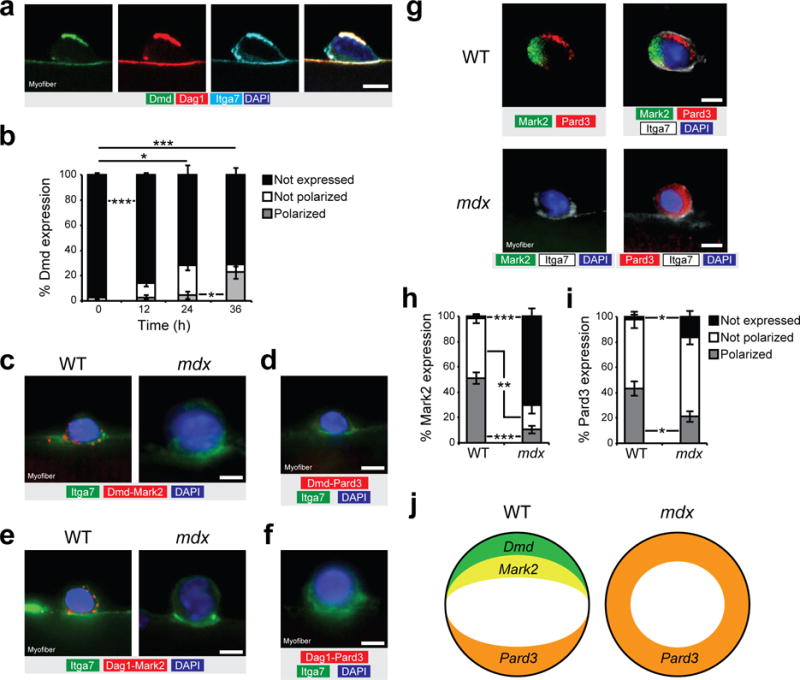
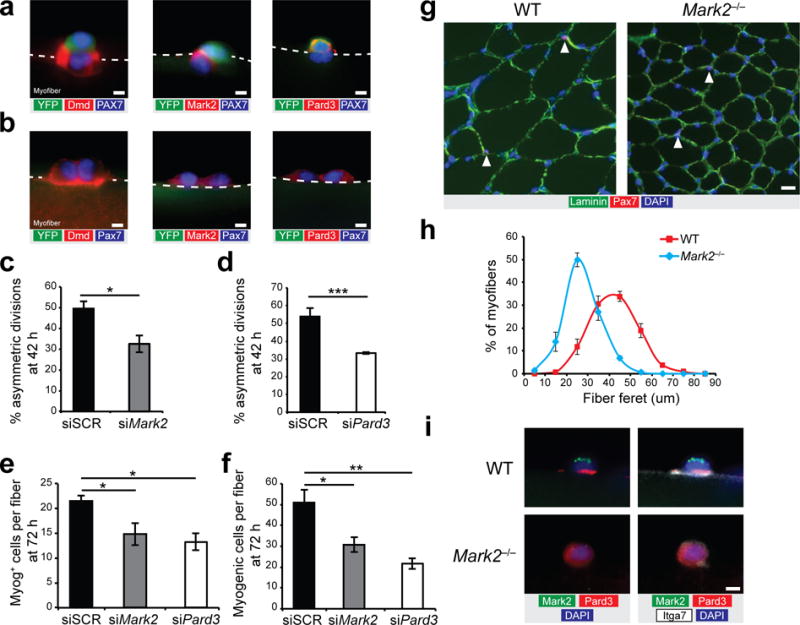
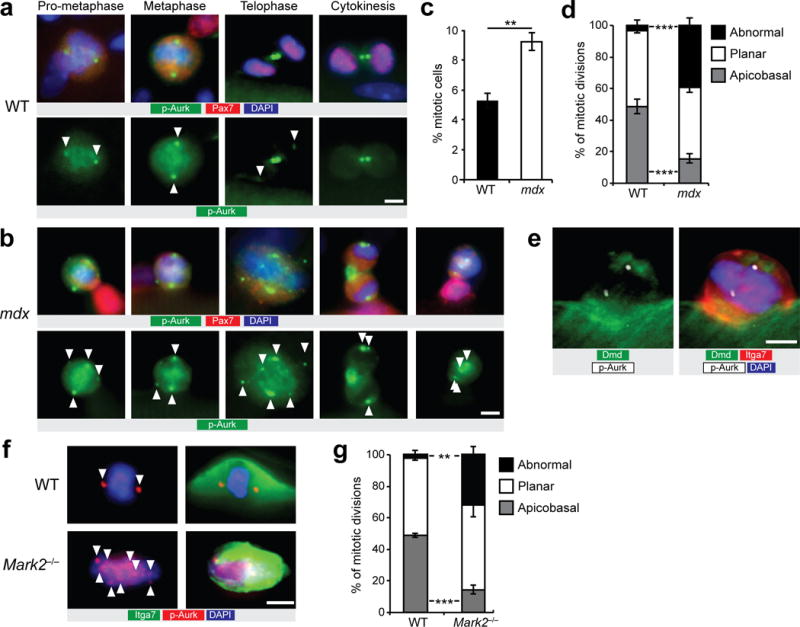
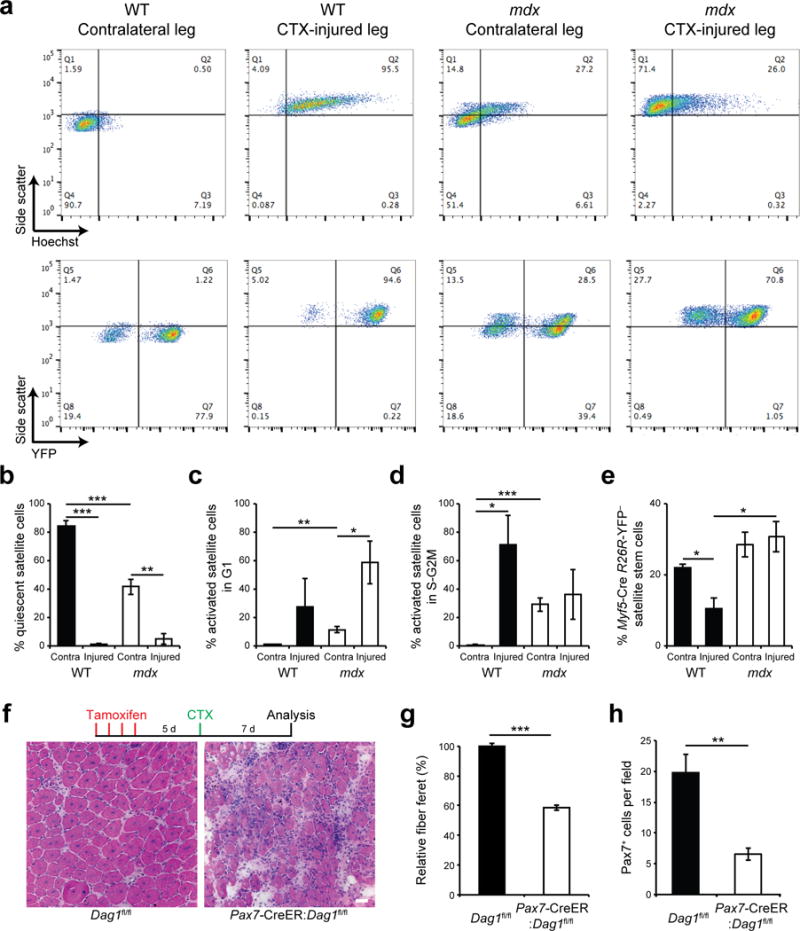
Dystrophin is expressed in differentiated myofibers, in which it is required for sarcolemmal integrity, and loss-of-function mutations in the gene that encodes it result in Duchenne muscular dystrophy (DMD), a disease characterized by progressive and severe skeletal muscle degeneration. Here we found that dystrophin is also highly expressed in activated muscle stem cells (also known as satellite cells), in which it associates with the serine-threonine kinase Mark2 (also known as Par1b), an important regulator of cell polarity. In the absence of dystrophin, expression of Mark2 protein is downregulated, resulting in the inability to localize the cell polarity regulator Pard3 to the opposite side of the cell. Consequently, the number of asymmetric divisions is strikingly reduced in dystrophin-deficient satellite cells, which also display a loss of polarity, abnormal division patterns (including centrosome amplification), impaired mitotic spindle orientation and prolonged cell divisions. Altogether, these intrinsic defects strongly reduce the generation of myogenic progenitors that are needed for proper muscle regeneration. Therefore, we conclude that dystrophin has an essential role in the regulation of satellite cell polarity and asymmetric division. Our findings indicate that muscle wasting in DMD not only is caused by myofiber fragility, but also is exacerbated by impaired regeneration owing to intrinsic satellite cell dysfunction.


Conflict of interest statement

COMPETING FINANCIAL INTERESTS

The authors declare no competing financial interests.

Figures

Figure 1
Figure 1
Dystrophin expression in satellite cells. (a) Microarray heatmap representing genes from the DGC from prospectively isolated satellite cells, proliferating myoblasts cultured in vitro, and 2- and 5-day-differentiated myotubes. Signal intensities represent the average of n = 3 microarrays for myoblasts and myotubes, and n = 1 microarray for satellite cells obtained from pooled freshly isolated satellite cells of nine mice. (b,c) Quantitative Real-time PCR for Dmd and Dag1 expression in satellite cells, myoblasts and myotubes. Error bars represent means ± SEM. ***P < 0.005. Statistical significance was calculated by Student’s t test. (d) Representative pictures (n > 20 pictures per condition) of immunostaining for Pax7 (red), Dmd N-terminal (green) and DAPI (blue) of satellite cells isolated by FACS from cardiotoxin-injured WT and mdx mice 2 days post-injury. n = 3 mice. (e) Representative pictures (n > 50 pictures per condition) of immunostaining for Pax7 (red), Dmd C-terminal (green) and DAPI (blue) of satellite cells from cultured myofiber at 0, 12, 24, or 36 h. n = 3 mice. Scale bars, 5 μm.
Figure 2
Figure 2
Impaired satellite stem cell asymmetric divisions and reduced generation of myogenic progenitors in absence of dystrophin. (a) Quantification of Pax7-expressing satellite cells per myofiber cultured for 0 or 72 h from WT and mdx Myf5-Cre:R26R-YFP mice. (b) Proportion of Pax7-positive YFP-negative satellite stem cells on myofibers cultured for 0 h or 72 h. (c) Quantification of Pax7-positive YFP-positive committed satellite cells per fiber. (d) Representative micrographs (n > 20 micrographs) of a planar symmetric stem cell division (left) and an apicobasal asymmetric division (right). (df) Myofibers from Myf5-Cre:R26R-YFP mice immunostained for YFP (green), Pax7 (red), and DAPI (blue) after 42 h of culture. (e,f) Quantification of asymmetric divisions relative to total satellite stem cell divisions in (e) WT and mdx myofibers and (f) WT myofibers knockdown of dystrophin (siDmd) or scramble control (siSCR). (g,h) Myog-expressing cells per myofiber cultured for 72 h from (g) WT and mdx mice and (h) WT myofibers treated with siDmd or siSCR. Error bars represent means ± SEM. n = 4 mice for every panel except for f (n = 5) and h (n = 3); 30–50 myofibers per mice. *P < 0.05, **P < 0.01, ***P < 0.005. Statistical significance was calculated by Student’s t test or Wilcoxon Rank-sum test for e. (i) Representative micrographs (n = 10 micrographs per condition) of cultured myofibers from WT mice at 72 h and treated with siSCR or siDmd and stained for Pax7 (green), Myog (red), and DAPI (blue), n = 3 mice. Scale bar, 5 μm.
Figure 3
Figure 3
Dystrophin regulates PAR polarity protein localization. (a) Immunostaining for Dmd C-terminal (green), Dag1 (red), itga7 (cyan) and DAPI (blue) of cultured myofiber at 36 h. (b) Quantification of Dmd expression (rod domain) and localization in satellite cells of cultured myofibers of WT mice at 0, 12, 24, and 36 h. Only undivided cells were quantified. n = 3 mice, approx. 50 cells per mice. (c) Representative micrograph (n = 10 micrographs per condition) of proximity ligation assay (PLA) for Dmd (Dy4/6D3 clone) and Mark2 (red) and for (d) Dmd and Pard3 (red), along with immunostaining for itga7 (green) and DAPI (blue) on cultured myofibers from WT and mdx mice at 36 h. n = 3 mice. (e) Representative micrograph (n = 10 micrographs per condition) of proximity ligation assay (PLA) between Dag1 and Mark2 (red), and between (f) Dag1 and Pard3 (red), along with immunostaining for itga7 (green) and DAPI (blue) on cultured myofibers from WT and mdx mice at 36 h. n = 3 mice. (g) Example (n = 10 micrographs per condition) of polarity protein distribution from immunostaining for Mark2 (green), Pard3 (red), itga7 (white) and DAPI (blue) of cultured myofiber from WT and mdx mice at 36 h. n = 3 mice. (h,i) Quantification for (h) Mark2 and (i) Pard3 expression and localization in satellite cells of cultured myofibers of WT and mdx mice at 36 h. n = 4 mice, 30–50 cells per mice. (j) Schematic representation of the polarity establishment in WT and mdx satellite cells. Error bars represent means ± SEM. P* < 0.05, **P < 0.01, ***P < 0.005. Statistical significance was calculated by Student’s t test. Scale bars, 5 μm.
Figure 4
Figure 4
PAR polarity proteins are required for muscle stem cell asymmetric divisions. (a,b) Myofibers from Myf5-Cre:R26R-YFP mice cultured for 42 h and immunostained for YFP (green), Pax7 (blue) and Dmd (Dy4/6D3, red; left panel), or Mark2 (red; middle panel), or Pard3 (red; right panel) in (a) asymmetric cell pairs (YFP-positive/YFP-negative pairs) and (b) symmetric YFP-negative cell pairs (YFP-negative/YFP-negative pairs). Representative pictures from n = 10–20 pictures per condition. (c,d) Quantification of asymmetric divisions relative to total satellite stem cell divisions in cultured myofibers of Myf5-Cre:R26R-YFP mice following knockdown of (c) Mark2 (siMark2) or (d) Pard3 (siPard3) compared to scramble siRNA (siSCR). (e) Quantification of Myog-expressing cells per fiber and (f) total myogenic cells (Pax7-expressing or Myog-expressing cells) per fiber from WT myofibers cultured 72 h treated with siMark2, siPard3, or siSCR. (cf) n = 3 mice except for c where n = 5 and d where n = 4, 30–40 myofibers per mice. (g) Representative pictures (n > 10 pictures) from WT and Mark2−/− section from TA muscle immunostained for laminin (green), Pax7 (red), and DAPI (blue). n = 3 mice. (h) Distribution of minimal fiber feret size from the TA muscle of Mark2−/− mice (blue) and WT littermate (red). n = 3 mice, >300 fibers counted per mouse. (i) Representative pictures (n = 5-10 pictures per condition) of immunostaining for Mark2 (green), Pard3 (red), itga7 (white), and DAPI (blue) of cultured myofiber from WT and Mark2−/− mice at 36 h. n = 3 mice. Error bars represent means ± SEM. *P < 0.05, **P < 0.01, ***P < 0.005. Statistical significance was calculated by Student’s t test. (a,b,i) Scale bars, 5 μm and (g)10 μm.
Figure 5
Figure 5
Dystrophin-deficient satellite cells display impaired mitotic spindle orientation and loss of apicobasal division. (a) Representative pictures (n > 50 pictures) of immunostaining for phospho-Aurora kinase (p-Aurk; green), Pax7 (red), and DAPI (blue) of cultured myofibers from WT mice at 36 h. (b) Representative images (n > 20 pictures) of abnormal mitotic events of cultured myofibers from mdx mice at 36 h immunostained for p-Aurk (green), Pax7 (red), and DAPI (blue). (a,b) Mitotic centrosomes (arrowheads) are stained with anti-p-Aurk antibody in prophase and metaphase cells. (c) Proportion of mitotic satellite cells on cultured myofibers from WT and mdx mice at 36 h. (d) Quantification of abnormal, versus planar, and apicobasal orientated mitotic spindles in satellite cells on myofibers from WT and mdx mice after 36 h of culture. (c,d) n = 3 WT mice and n = 4 mdx mice, approximately 100 cells total per condition. (e) Example of immunostaining (n = 10 pictures) for Dmd rod domain (green), itga7 (red), p-Aurk (white) and DAPI (blue) in a mitotic satellite cell undergoing an apicobasal division. (f) Examples of mitotic satellite cells (n > 10 pictures) from immunostaining for itga7 (green), p-Aurk (red), and DAPI (blue) of cultured myofiber from Mark2−/− mice at 36 h. n = 3 mice. (g) Quantification of abnormal, versus planar, and apicobasal orientated mitotic spindles in satellite cells on myofibers from WT and Mark2−/− mice after 36 h of culture. n = 3 mice, >20 fibers counted per condition. (c,d,g) Error bars represent means ± SEM. *P < 0.05, **P < 0.01, ***P < 0.005. Statistical significance was calculated by Student’s t test. Scale bars, 5 μm.
Figure 6
Figure 6
Dystrophin-deficient satellite cells have reduced ability to generate myogenic progenitors in regenerating muscle. (a) Flow cytometric analysis of WT and mdx Myf5-Cre:R26R-YFP mice 3 days after cardiotoxin (CTX) injury. Upper panels display the distribution of myogenic cells by side scatter (SSC, y-axis) and DNA content (x-axis) based on Hoechst 33342 staining, while lower panels profile their side scatter (y-axis) and YFP expression (x-axis). (bd) Proportions of quiescent (SSC-low, DNA-low), activated G1 (SSC-high, DNA-low), and proliferating S-G2M (SSC-high, DNA-high) myogenic cells from CTX-injured or contralateral (Contra.) muscles of WT and mdx Myf5-Cre:R26R-YFP mice. (e) Proportions of YFP-negative satellite stem cells from CTX-injured or Contra. muscles of WT and mdx Myf5-Cre:R26R-YFP mice. (be) n = 3 mice per condition. (f) Representative pictures (n > 10 pictures per condition) from H&E staining of TA muscle sections of tamoxifen-treated Dag1fl/fl and Pax7-CreER:Dag1fl/fl mice 7 days after CTX-injury. n = 3 mice. Scale bar, 20 μm. (g) Relative fiber feret, and (h) satellite cell density (Pax7-expressing cells) from TA muscle sections of tamoxifen-treated Dag1fl/fl and Pax7-CreER:Dag1fl/fl mice 7 days after CTX-injury. n=3 mice per condition. (be,g,h) Error bars represent means ± SEM. *P < 0.05, **P < 0.01, ***P < 0.005. Statistical significance was calculated by Student’s t test.

Comment in

References

    1. Anderson MS, Kunkel LM. The molecular and biochemical basis of Duchenne muscular dystrophy. Trends Biochem Sci. 1992;17:289–292. - PubMed
    1. Cohn RD, Campbell KP. Molecular basis of muscular dystrophies. Muscle Nerve. 2000;23:1456–1471. - PubMed
    1. Koenig M, et al. Complete cloning of the duchenne muscular dystrophy (DMD) cDNA and preliminary genomic organization of the DMD gene in normal and affected individuals. Cell. 1987;50:509–517. - PubMed
    1. Serrano AL, et al. Cellular and molecular mechanisms regulating fibrosis in skeletal muscle repair and disease. Curr Top Dev Biol. 2011;96:167–201. - PubMed
    1. Cohn RD, et al. Disruption of Dag1 in Differentiated Skeletal Muscle Reveals a Role for Dystroglycan in Muscle Regeneration. Cell. 2002;110:639–648. - PubMed

Publication types

MeSH terms